Home Gym Survey Results: October 2026
Introduction
Every week, we ask the most involved home gym owners in the space to tell us what’s really going on in their garages, basements, and spare rooms. October results are in.
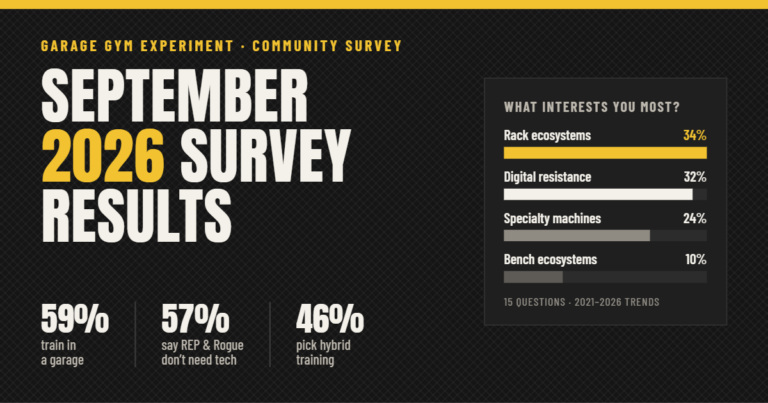
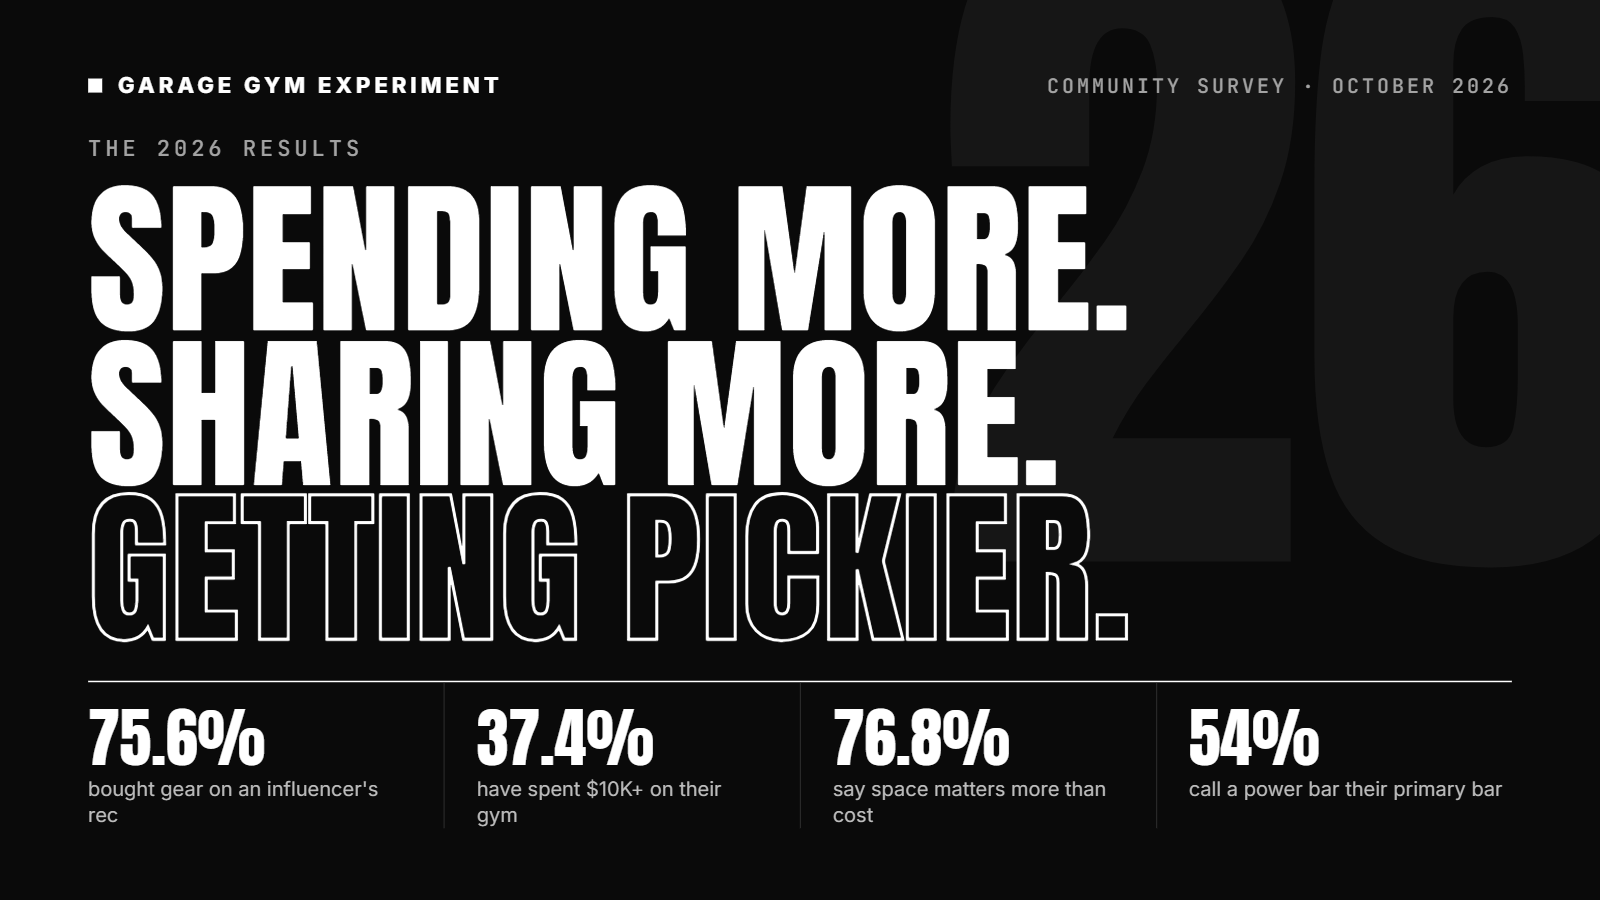
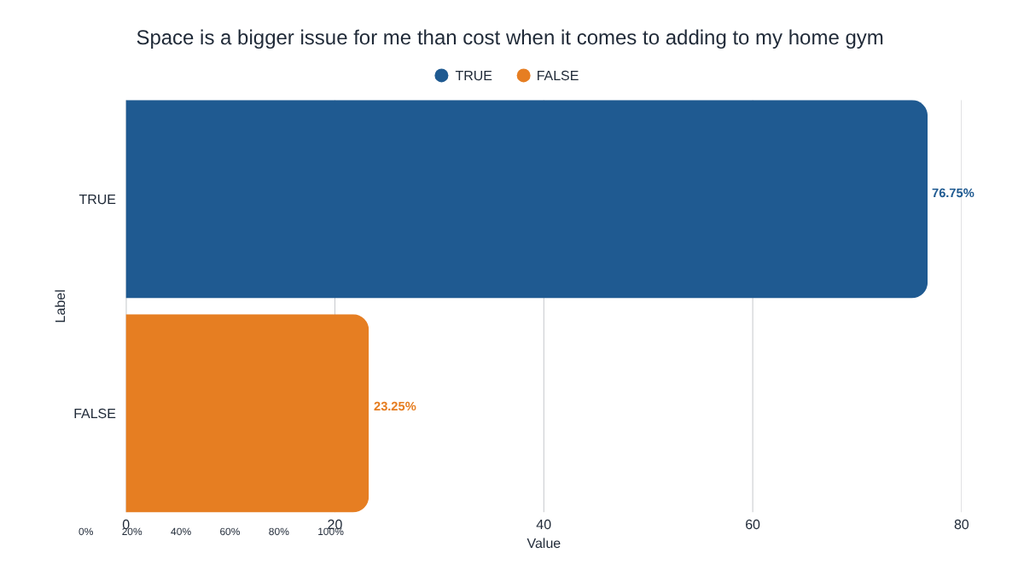
A few headlines jumped out right away. More than 37% of you have now put over $10,000 into your home gyms, up from about 31% last year. Nearly half have been at it for five to ten years. And while you’re spending more, space is still the main pressure. Over three-quarters of you say space matters more than cost, which helps explain why adjustable kettlebells flipped from the minority pick to the majority in just two years.
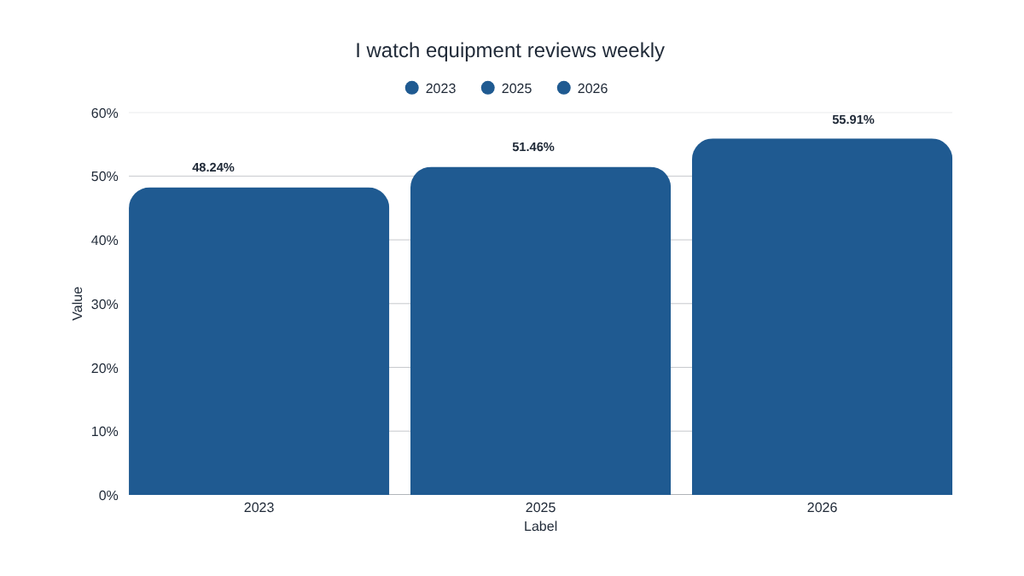
Who you trust is shifting too. Three out of four of you have bought gear based on an influencer’s recommendation, weekly review viewership hit a new high, and word-of-mouth from friends and family is climbing. Meanwhile, the pull of meeting a seller in person and of founder-led marketing both cooled off noticeably.
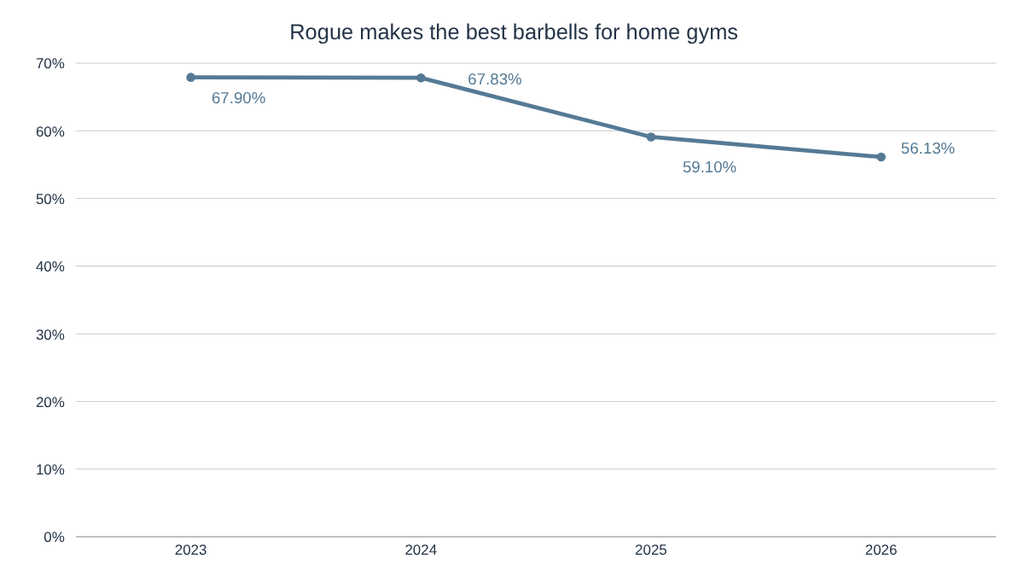
The barbell world had its own storyline. Power bars hit an all-time high as the primary bar of choice, Oly bars kept sliding, and Rogue’s grip on “best barbell” slipped again, down nearly 12 points since 2023.
There’s a lot more below, from the air bike vs. rower debate to the state of the used market, where more of you sold gear this year than bought it. Let’s get into it.
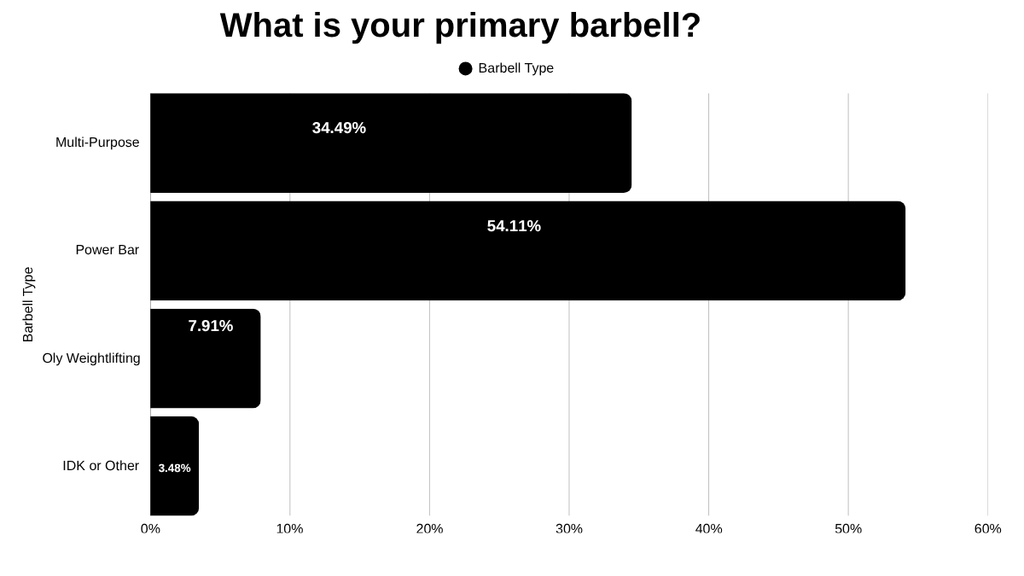
What is your primary barbell?
Power bars are the clear favorite among home gym lifters, with 54% calling one their primary barbell, while multi-purpose bars hold a solid second at 34%. Olympic weightlifting bars (8%) and “IDK/Other” (3%) barely register, so this crowd leans heavily toward bars built for the big three.
How has that trended?
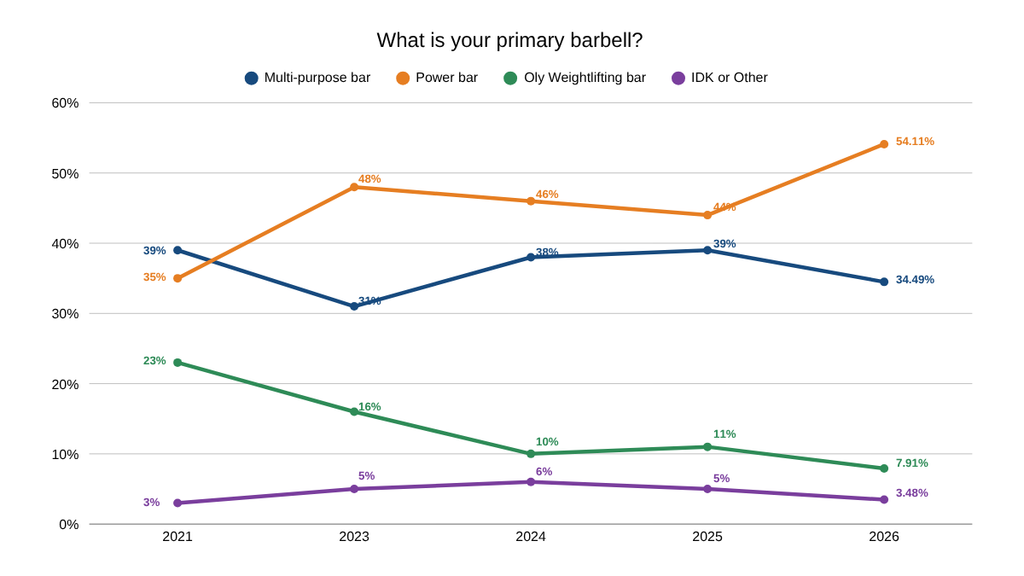
Power bars have become the clear favorite: they jumped from 35% in 2021 to 48% in 2023, dipped slightly over the next two years, then hit a new high of 54% in 2026. Multi-purpose bars led in 2021 at 39% and have held fairly steady between 31% and 39% since, ending at about 34.5%, so the gap between the two is now about 20 points, the widest yet. Olympic weightlifting bars have fallen steadily, from 23% to just under 8%. “IDK or Other” has stayed small at 3–6%. Overall, the home gym audience has moved toward powerlifting-specific equipment and away from Oly-specific bars.
How often do you use a barbell?
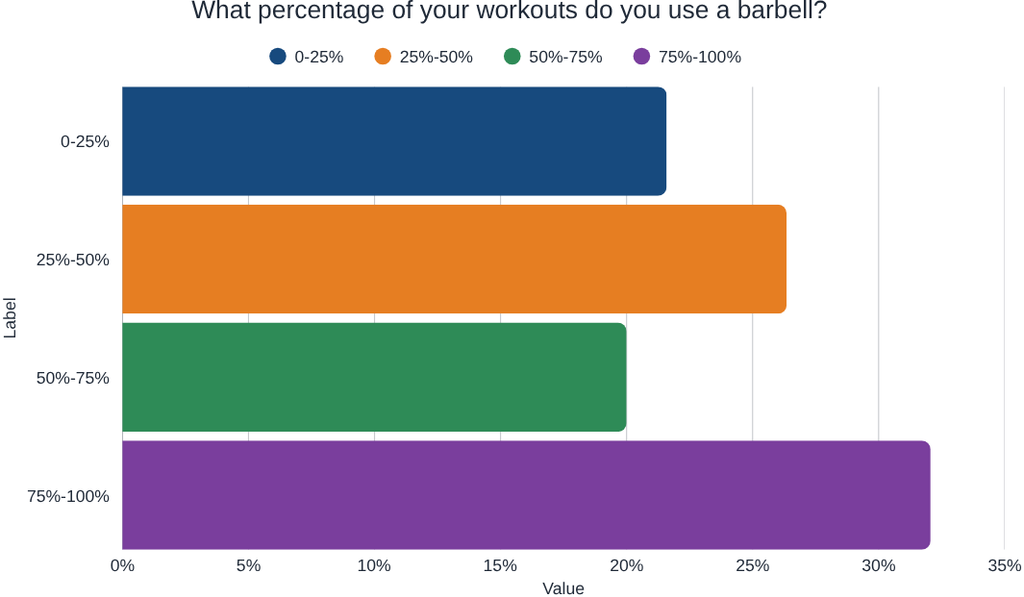
The largest group (32.06%) reported using a barbell for 75–100% of their workouts, followed by 26.35% who use one for 25–50% of their workouts. Overall, the results suggest that barbells are a popular piece of workout equipment, with over half of respondents using them in at least 50% of their workouts.
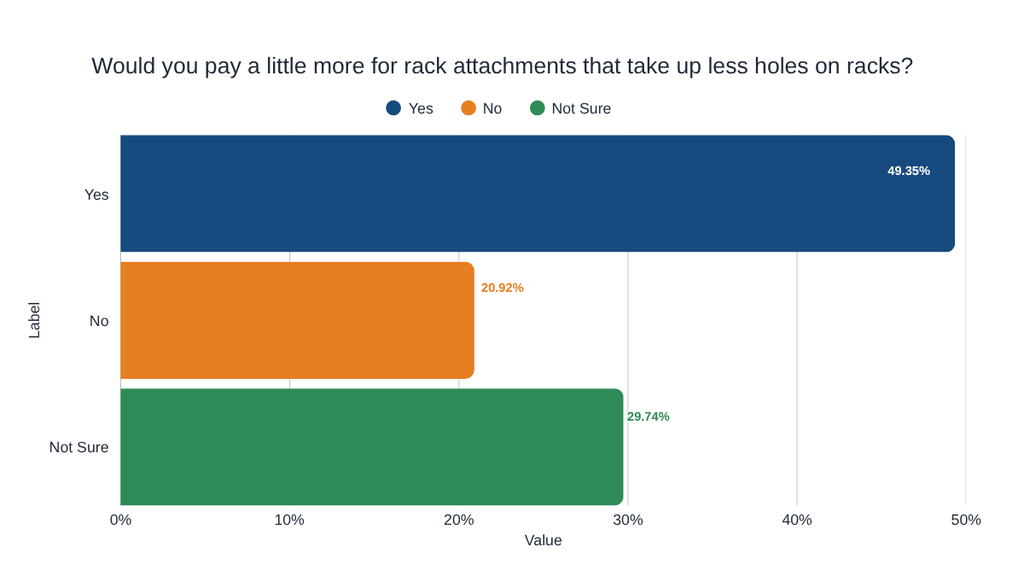
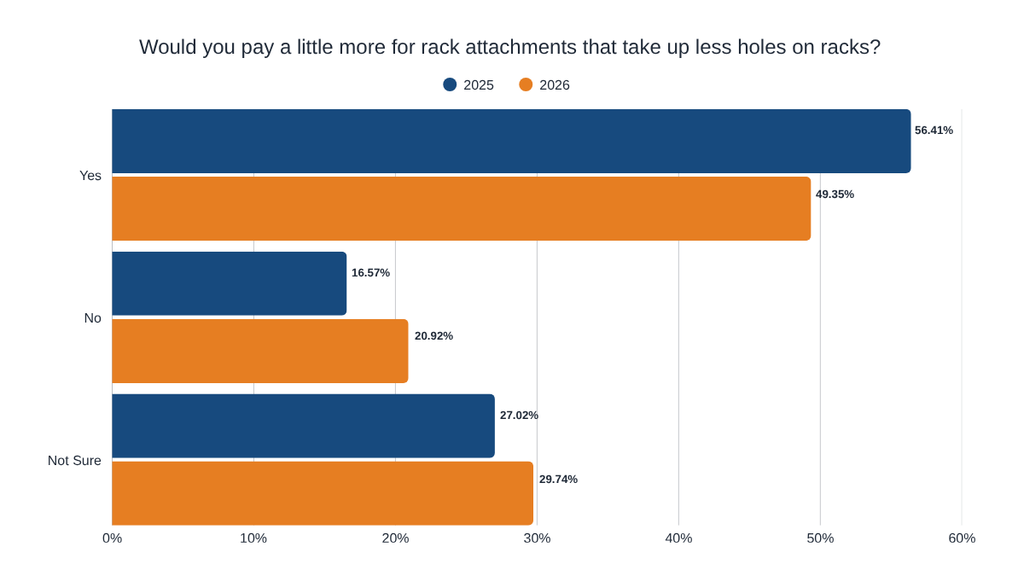
Would you pay more for rack attachments that take up less holes?
Nearly half of respondents (49.35%) indicated they would pay more, while 29.74% were unsure and only 20.92% said they would not. Overall, the results portray a strong consumer interest in more space-efficient rack attachments, with potential opportunities for manufacturers to offer these products at a slightly higher price.
Willingness to pay for a rack attachment with less holes from 2025 to 2026
The percentage willing to pay more decreased from 56.41% in 2025 to 49.35% in 2026, while those unwilling to pay increased from 16.57% to 20.92%. Overall, the data reveals that although consumer willingness to pay a premium has declined slightly, nearly half of respondents remain interested in paying more for compact rack attachments.
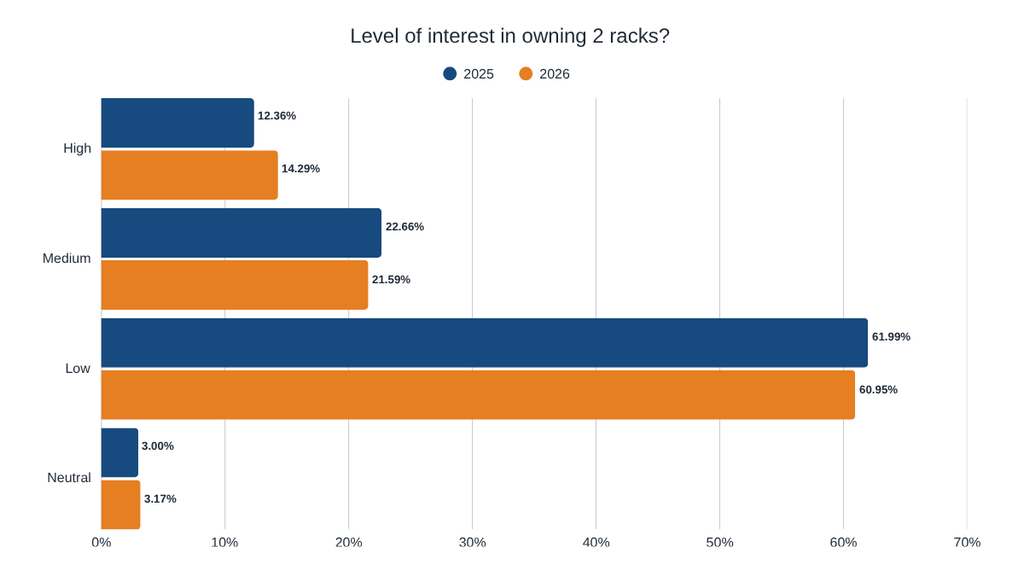
Level of interest in owning 2 racks?
The majority of respondents reported low interest, decreasing slightly from 61.99% in 2025 to 60.95% in 2026, while high interest increased from 12.36% to 14.29%. Overall, the data suggest that although interest in owning two racks has increased slightly, most consumers still prefer owning just one rack.
Weekly Equipment Review Viewership
Weekly viewership has steadily increased from 48.24% in 2023 to 51.46% in 2025 and 55.91% in 2026. Overall, the graph portrays that equipment reviews are becoming increasingly popular among home gym enthusiasts, highlighting their growing importance in the home gym industry.
Space vs. Cost in Home Gyms
A significant majority (76.75%) indicated that space was a greater concern than cost, while only 23.25% disagreed. Overall, the data shows that space efficiency is a major priority for home gym owners, highlighting the potential demand for compact and multifunctional equipment.
Space vs. Cost (2023–2026)
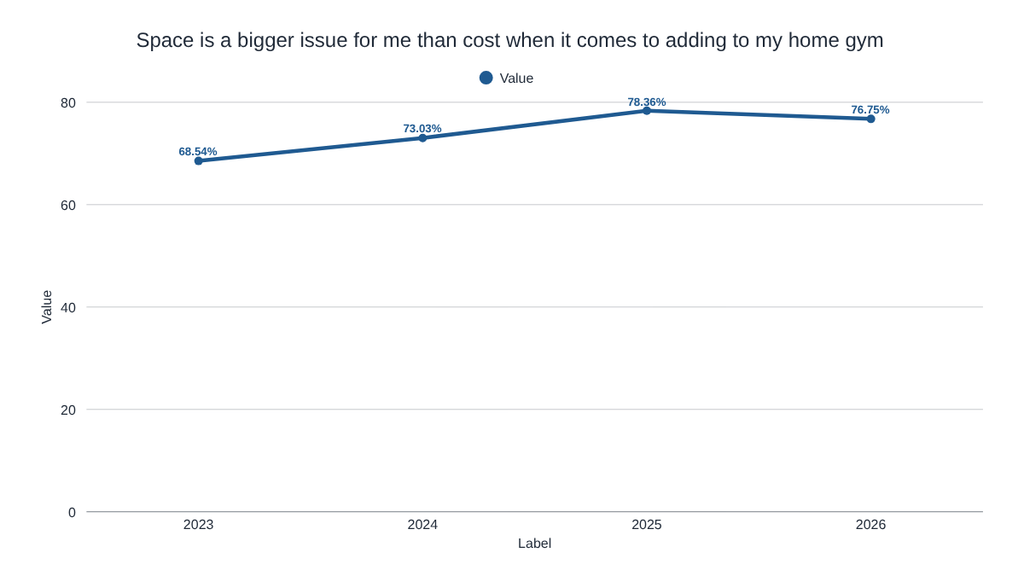
Space continues to be one of the biggest challenges for home gym owners. The percentage of respondents who prioritize space over cost increased from 68.54% in 2023 to 76.75% in 2026, peaking at 78.36% in 2025. While there was a slight decrease this year, it’s clear that making the most of available space remains a major priority.
Role of the Home Gym
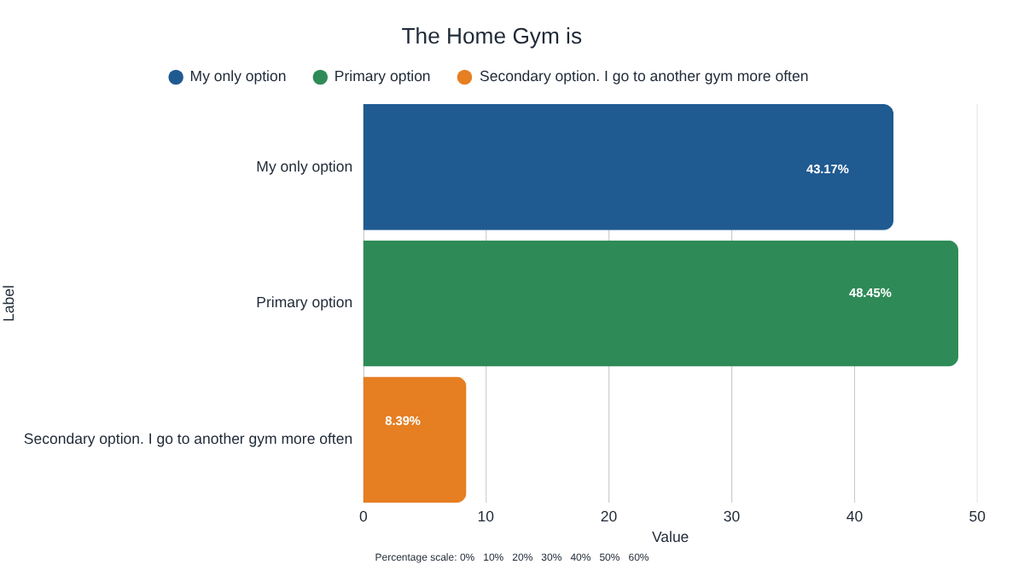
For most respondents, their home gym is where they get the majority of their workouts done. Nearly half (48.45%) said their home gym is their primary workout location, while another 43.17% rely on it exclusively. That means over 91% of respondents use their home gym as their main place to work out.
Number of People Using a Home Gym (2025–2026)
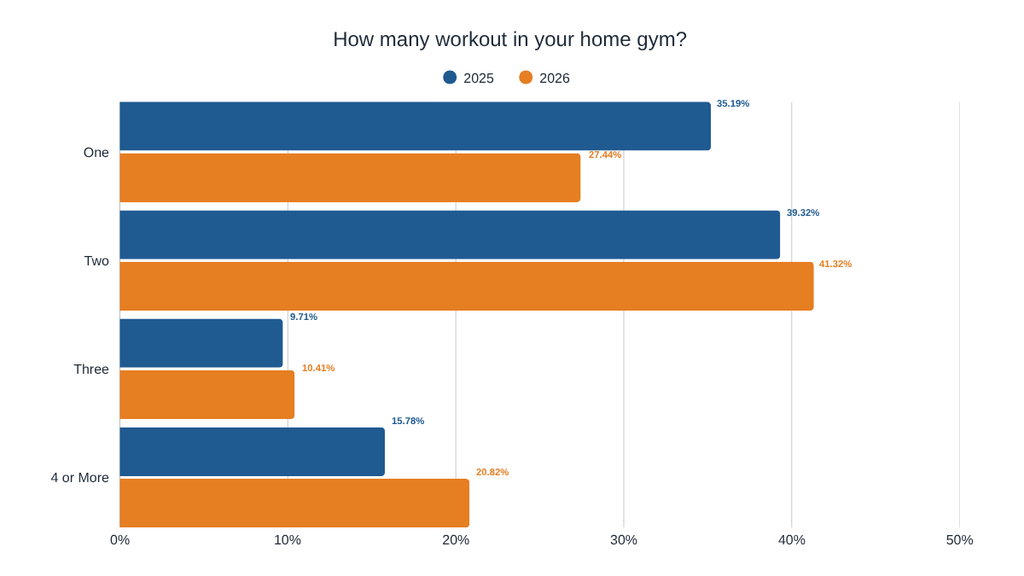
Home gyms are becoming more of a shared space. The percentage of respondents who work out alone dropped from 35.19% in 2025 to 27.44% in 2026, while home gyms with four or more users increased from 15.78% to 20.82%. These results suggest that more families and households are getting involved in home gym workouts together.
Bumper plates or Iron plates for a Home Gym?
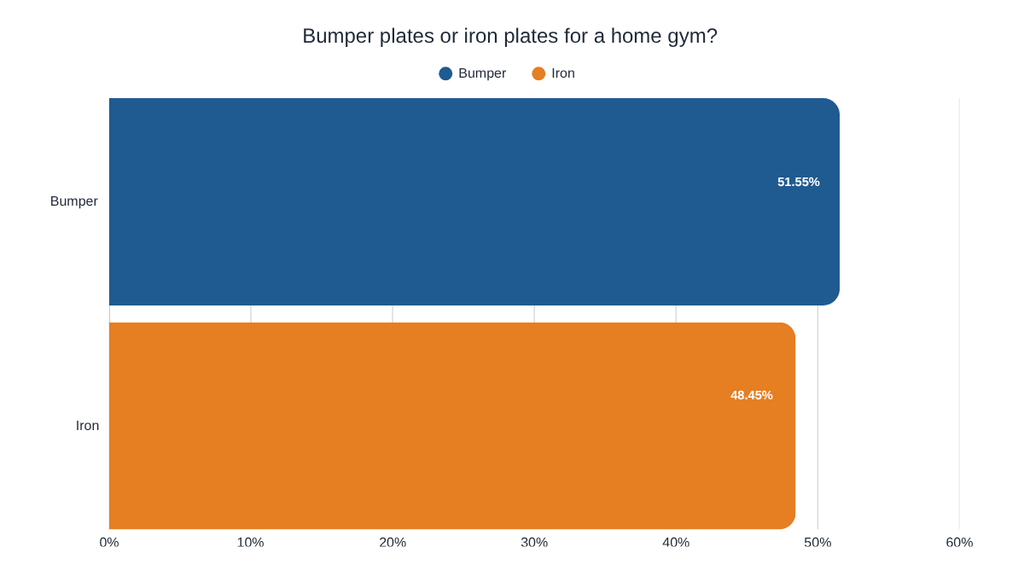
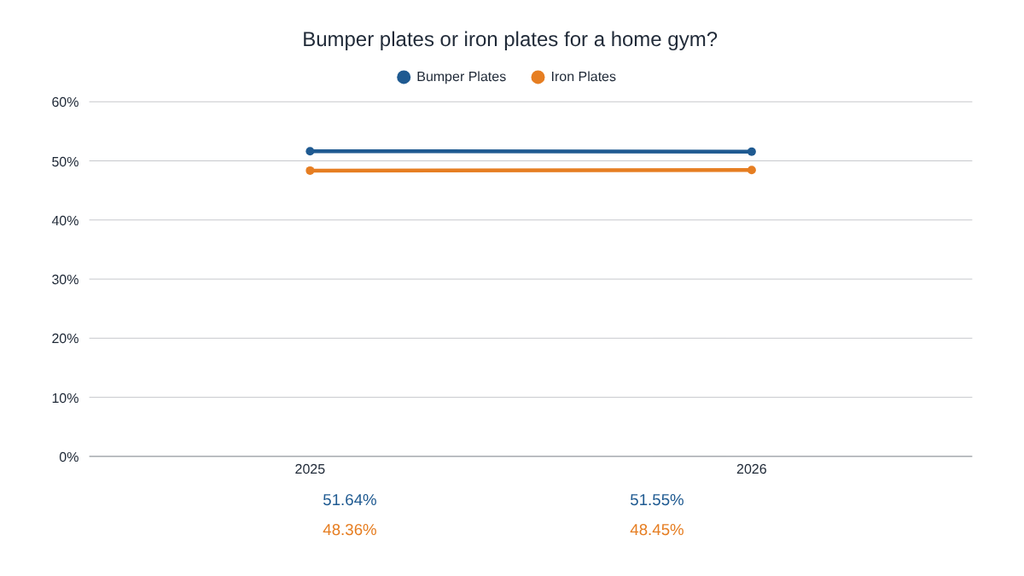
Home gym owners are almost evenly split between bumper plates and iron plates. Bumper plates have a slight edge, with 51.55% of respondents preferring them compared to 48.45% who favor iron plates. These results show that both types of weight plates remain popular choices for home gym setups.
Bumper Plates vs. Iron Plates (2025–2026)
Preferences for bumper and iron plates have remained nearly identical over the past year. Bumper plates decreased slightly from 51.64% in 2025 to 51.55% in 2026, while iron plates increased from 48.36% to 48.45%. This suggests that neither option is gaining a significant advantage, with home gym owners continuing to favor both types of plates almost equally.
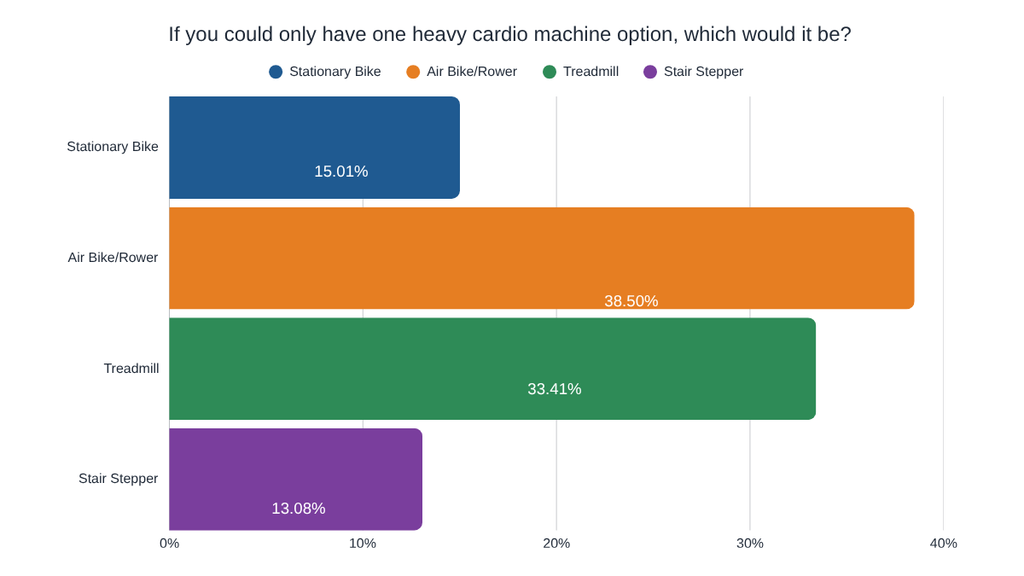
Preferred Heavy Cardio Machine
Air bikes and rowers are the most popular heavy cardio machine choices among home gym owners, receiving approximately 38% of responses. Treadmills follow closely at around 33%, while stationary bikes and stair steppers received approximately 15% and 13%, respectively. These results suggest that home gym owners tend to prefer versatile cardio machines that offer a variety of workout options.
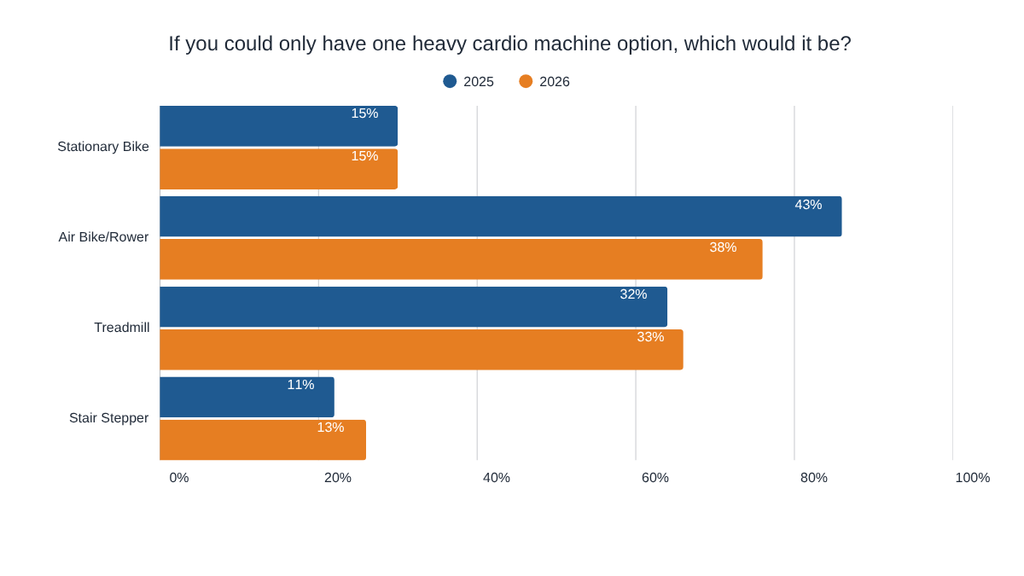
Preferred Heavy Cardio Machine (2025–2026)
Air bikes and rowers remain the most popular heavy cardio equipment, although their share dropped from approximately 43% in 2025 to 38% in 2026. Meanwhile, treadmills increased slightly from 32% to 33%, and stair steppers grew from 11% to 13%. These results mean that home gym owners are becoming slightly more interested in alternative cardio machines, even as air bikes and rowers maintain their lead.
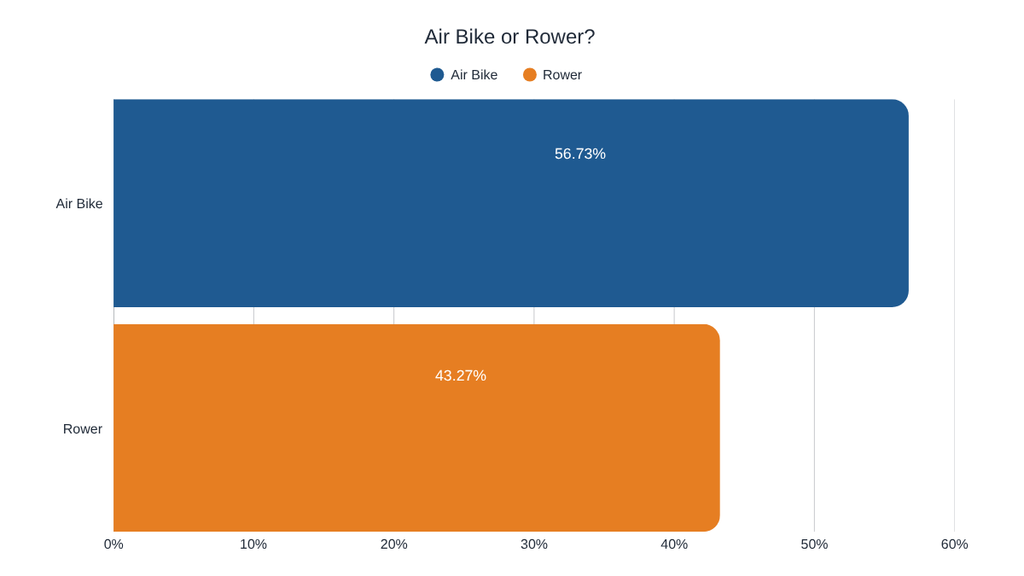
Air Bike vs. Rower
When choosing between an air bike and a rower, home gym owners show a preference for air bikes. Approximately 56.73% of voters favor air bikes, compared to 43.27% who prefer rowers. Although both machines remain popular, air bikes hold a noticeable advantage among respondents.
Preferred Air Bike Brand
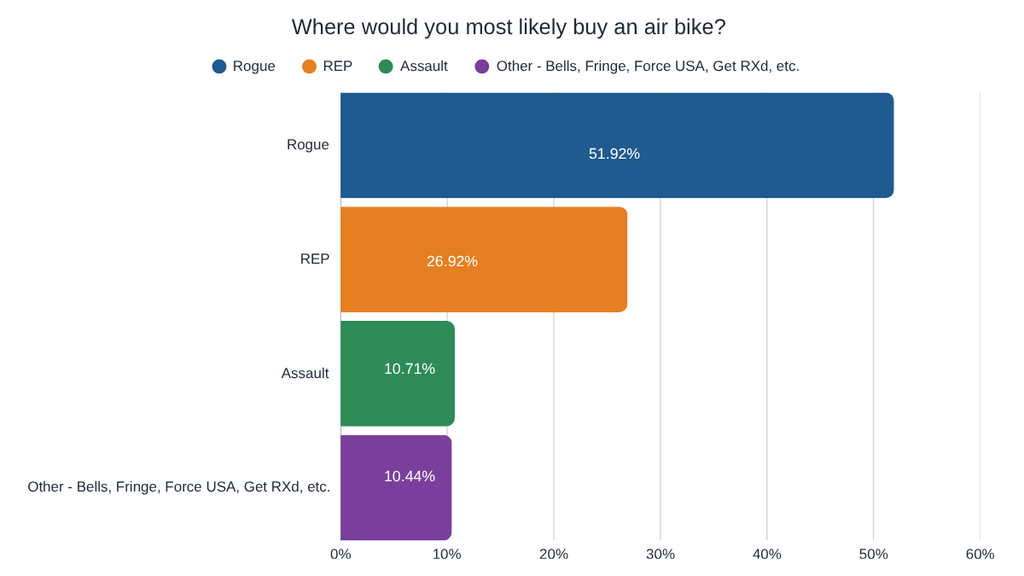
Rogue was the most preferred receiving 51.92% of responses. REP follows in second place with 26.92%, while Assault and other brands account for 10.71% and 10.44%, respectively. This poll shows that Rogue has a strong position in the home gym air bike market, with REP emerging as another popular option.
Preferred Rower Brand
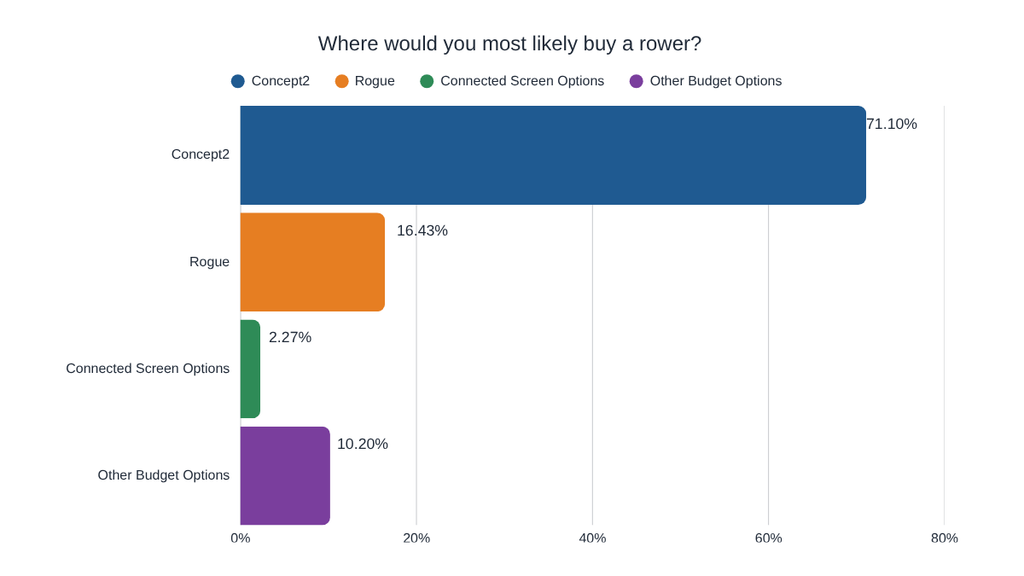
Concept2 finished with 71.10% of respondents selecting the brand. Rogue follows at 16.43%, while budget alternatives account for 10.20% and connected-screen options receive 2.27%.
Total Home Gym Spending
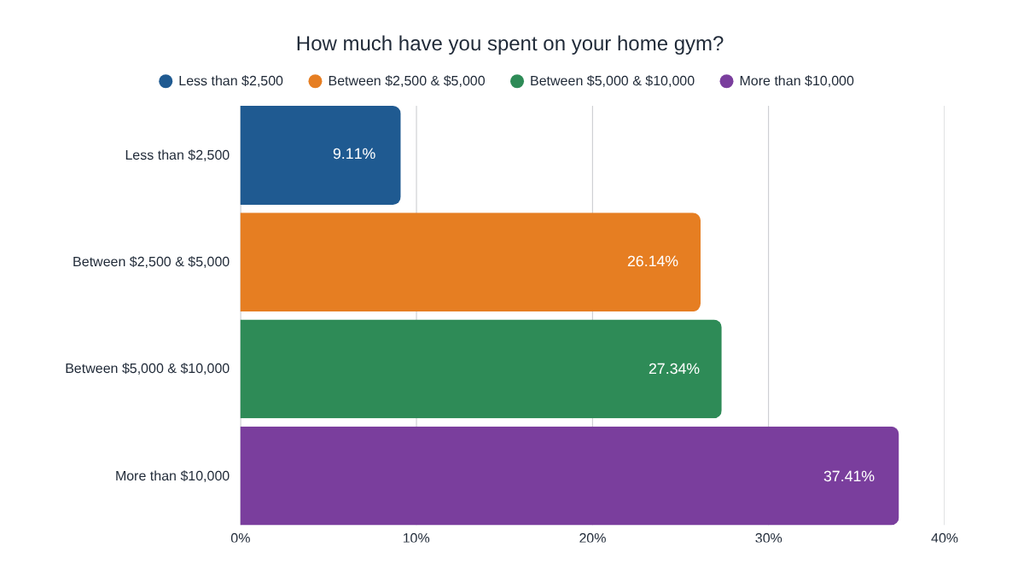
Home gym owners are making substantial investments in their workout spaces. Approximately 37.41% of voters have spent more than $10,000 on their home gyms, making it the largest spending category. Another 27.34% have spent between $5,000 and $10,000, while only 9.11% have spent less than $2,500. These results suggest that many home gym owners are willing to invest heavily in their equipment and setups.
Total Home Gym Spending (2025–2026)
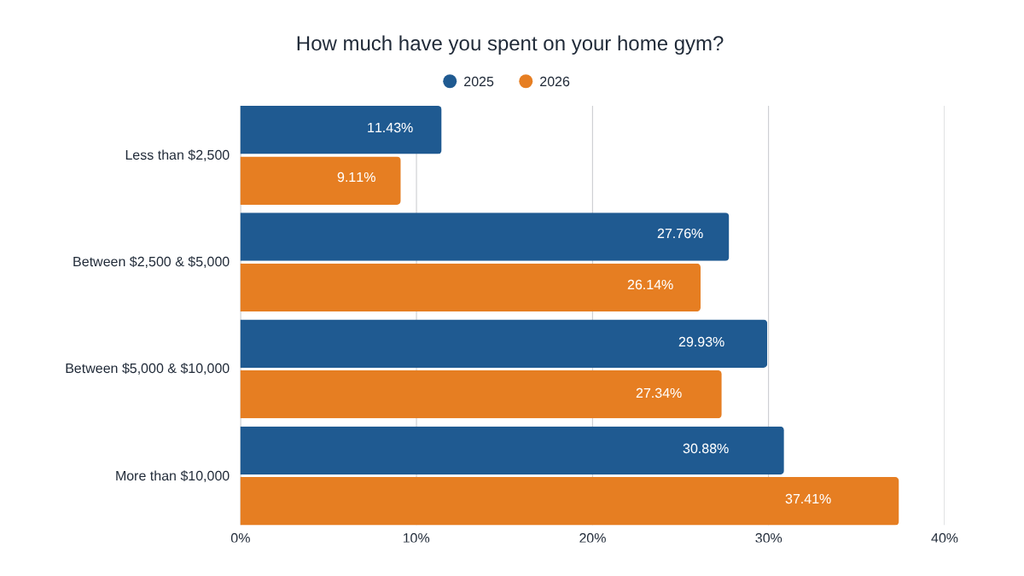
Home gym spending is increasing among survey respondents. The percentage of home gym owners who have invested more than $10,000 rose from 30.88% in 2025 to 37.41% in 2026. Meanwhile, every spending category below $10,000 experienced a decline. These results show that more home gym owners are building larger or more expensive setups.
Years of Home Gym Ownership
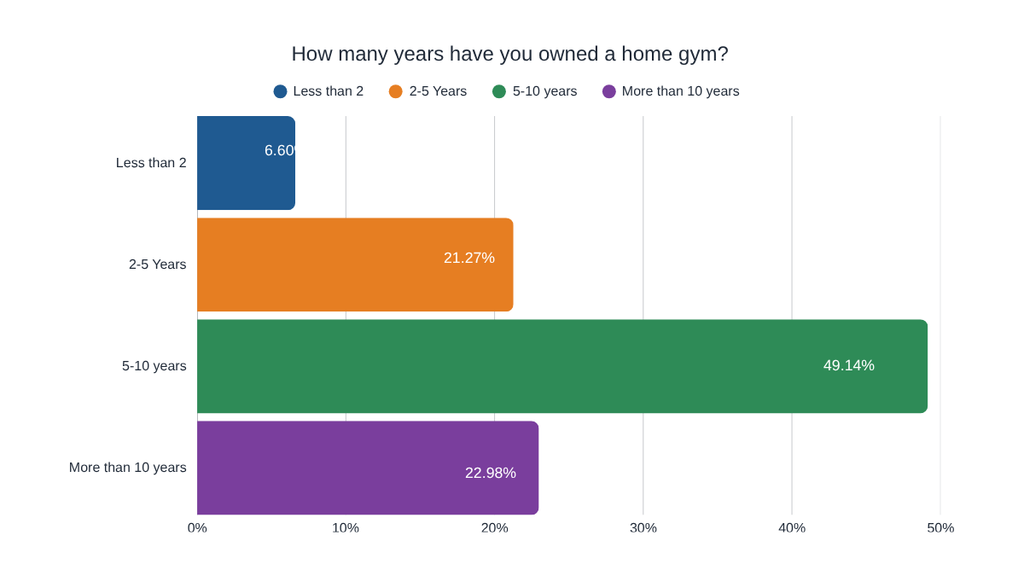
Most respondents have been building and using their home gyms for several years. Nearly half (49.14%) have owned a home gym for five to ten years, while another 22.98% have had one for more than a decade. Only 6.60% have owned their home gym for less than two years. These results indicate that the surveyed home gym community is largely made up of experienced owners.
Years of Home Gym Ownership (2025–2026)
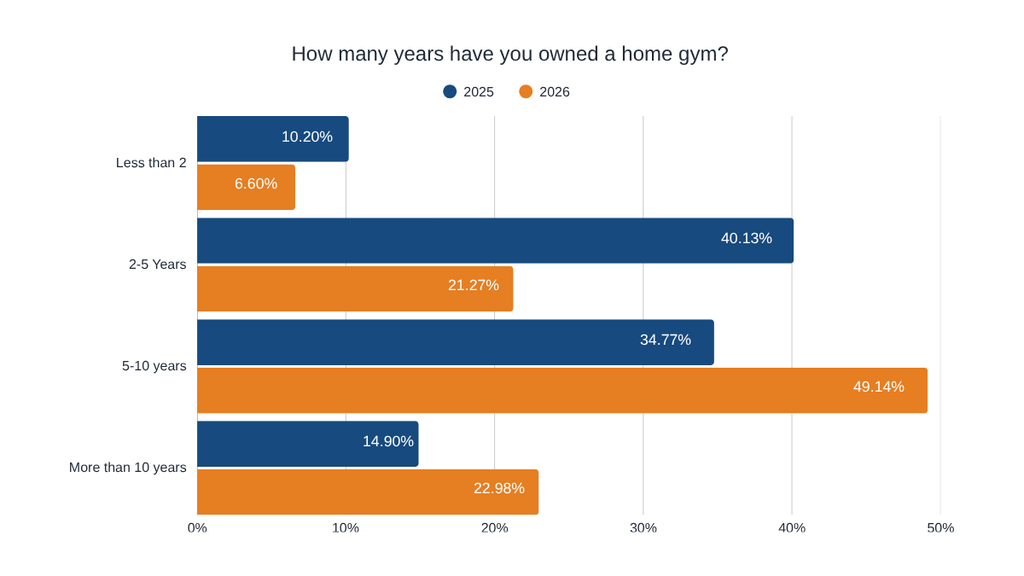
The home gym community surveyed is becoming increasingly experienced. Respondents who have owned a home gym for five to ten years increased from 34.77% in 2025 to 49.14% in 2026, while those with more than ten years of ownership rose from 14.90% to 22.98%. Meanwhile, the share of owners with less than five years of experience declined considerably. The survey depicts that longtime home gym owners are making up a larger portion of the surveyed community.
Interest in DIY Home Gym Projects
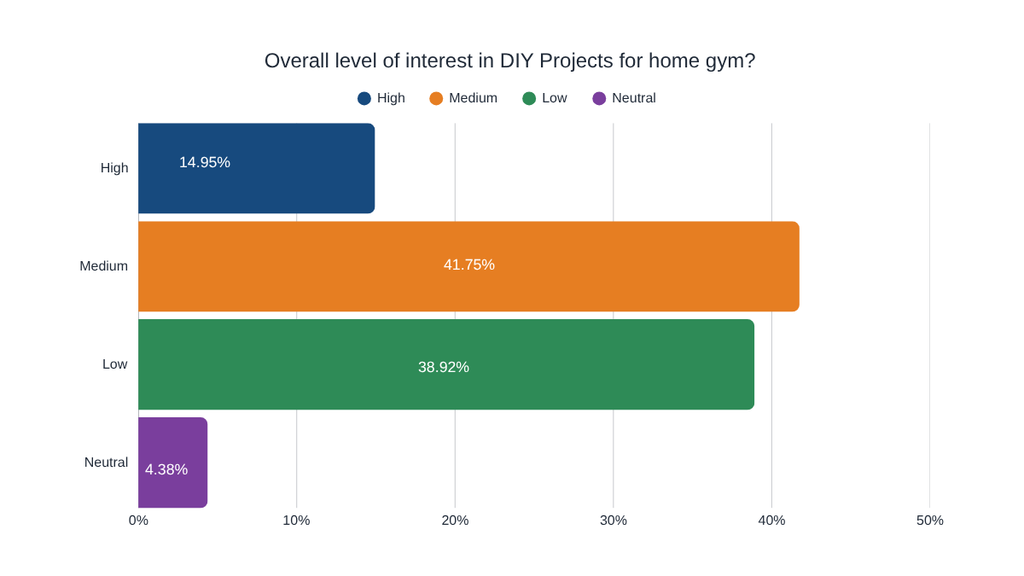
Interest in DIY home gym projects is relatively mixed. Approximately 41.75% of respondents report medium interest, while 38.92% have low interest and only 14.95% express high interest.
Interest in DIY Home Gym Projects (2024–2026)
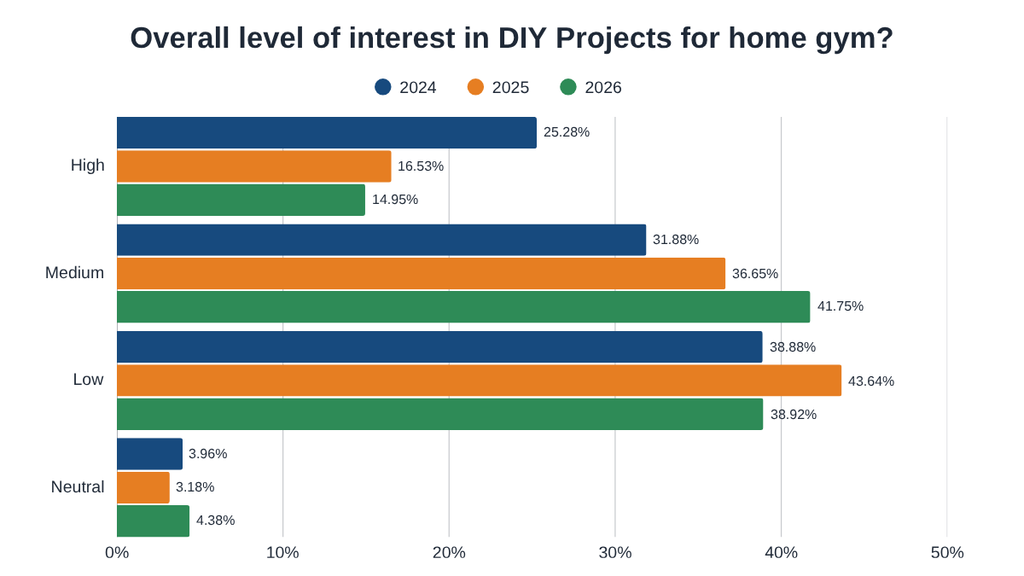
Enthusiasm for DIY home gym projects has shifted over the past three years. High interest declined from 25.28% in 2024 to 14.95% in 2026, while medium interest increased from 31.88% to 41.75%. These results suggest that home gym owners are becoming more moderately interested in DIY projects rather than pursuing them with high enthusiasm.
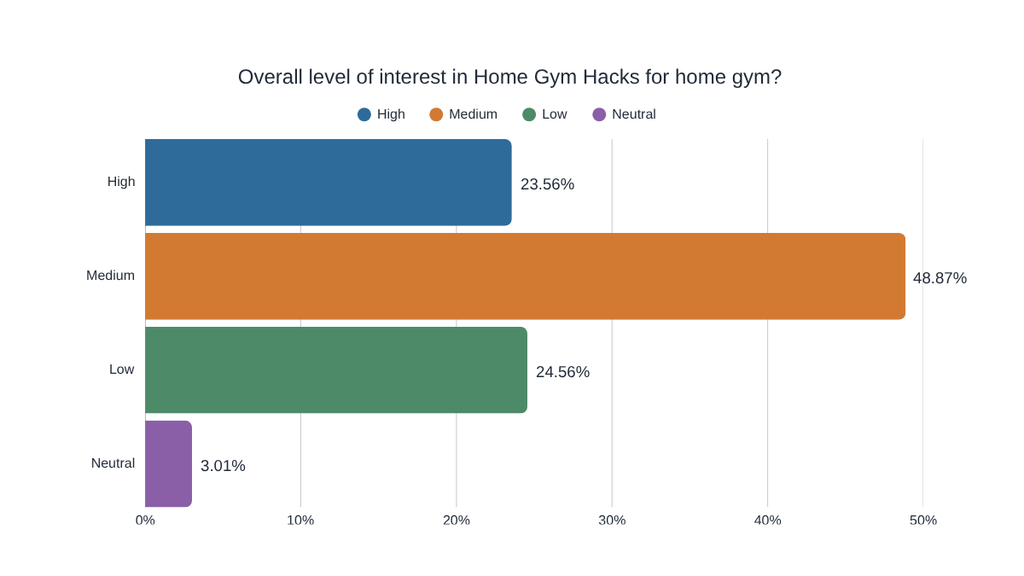
Interest in Home Gym Hacks
Home gym hacks continue to attract attention from respondents, with 48.87% reporting medium interest and another 23.56% expressing high interest. Meanwhile, 24.56% report low interest.
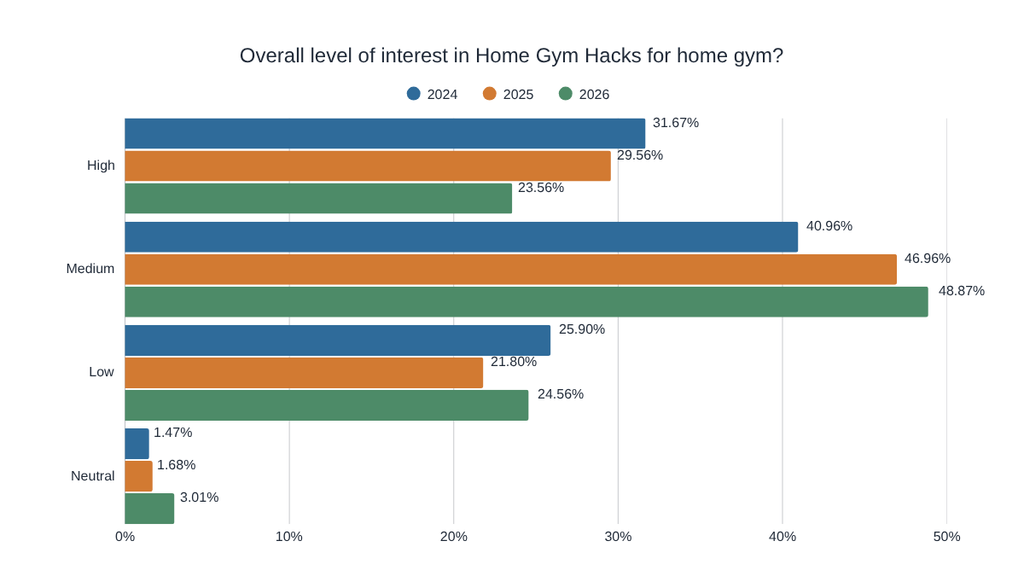
Interest in Home Gym Hacks (2024–2026)
Interest in home gym hacks has gradually shifted toward more moderate levels. High interest decreased from 31.67% in 2024 to 23.56% in 2026, while medium interest increased from 40.96% to 48.87%. This suggest that home gym owners still appreciate useful tips and tricks, but fewer voters consider them majorly interesting.
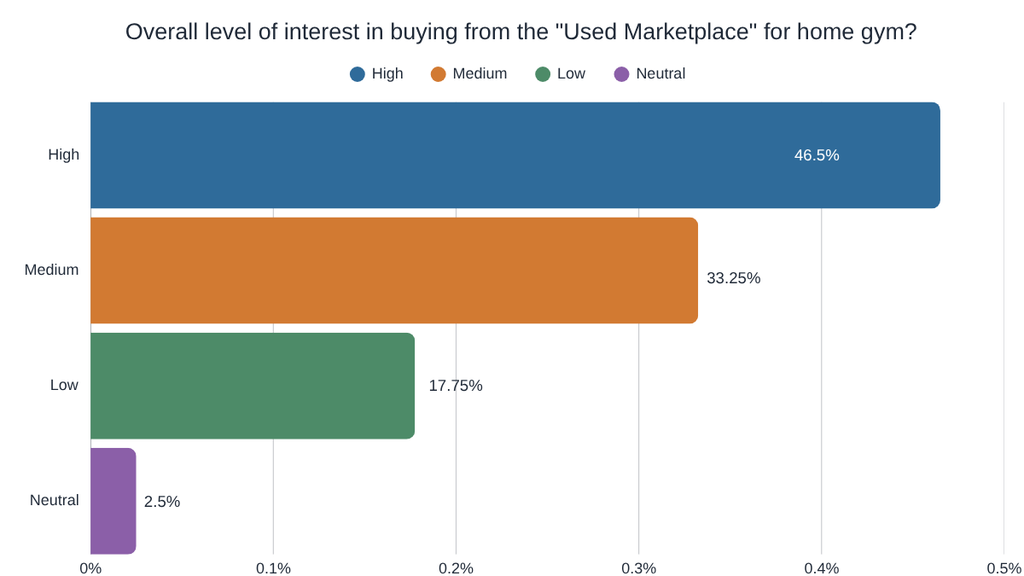
Interest in Buying Used Gym Equipment (2026)
Buying used equipment remains a popular option among home gym owners. Approximately 46.50% of respondents report high interest in purchasing equipment from the used marketplace, while another 33.25% express medium interest. With nearly 80% reporting medium or high interest, this means that secondhand equipment remains an important part of the home gym community.
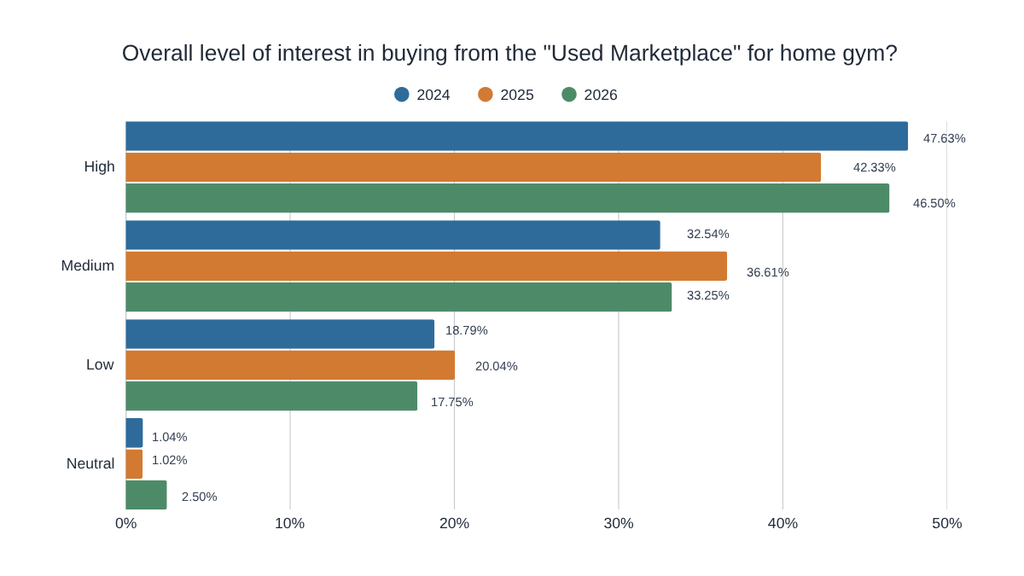
Interest in Buying Used Gym Equipment (2024–2026)
Interest in the used gym equipment marketplace remains strong. High interest increased from 42.33% in 2025 to 46.50% in 2026, approaching its 2024 level of 47.63%. Meanwhile, low interest dropped from 20.04% to 17.75% over the past year. This indicates that home gym owners continue to view secondhand equipment as an attractive purchasing option.
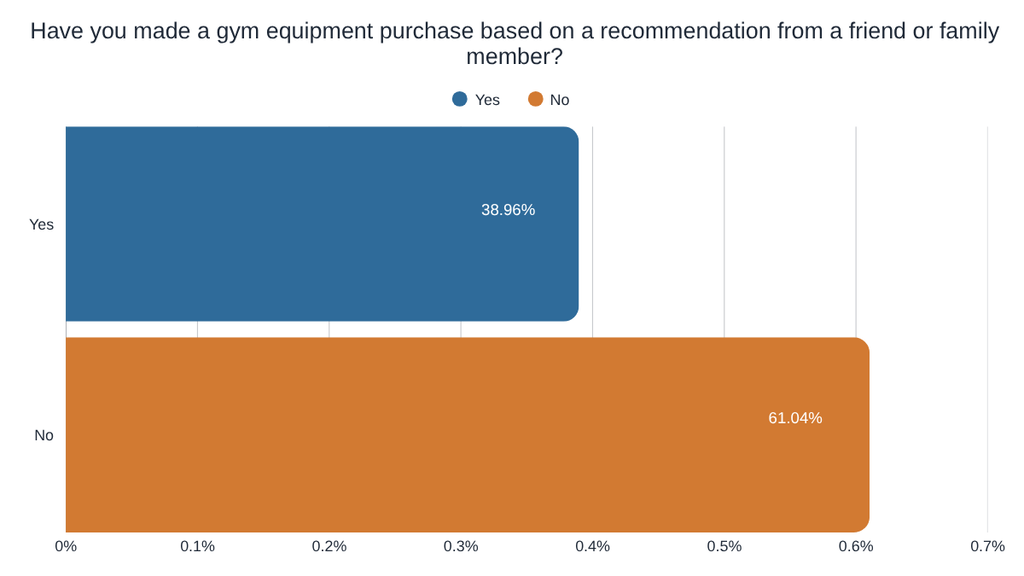
Purchases Based on Friends or Family Recommendations
Recommendations from friends and family influence a considerable portion of home gym purchases. Approximately 38.96% of respondents say they have purchased gym equipment based on a recommendation from someone they know, while 61.04% have not. This poll indicates that personal recommendations play a large role in purchasing decisions, although most respondents have not made a purchase based on them.
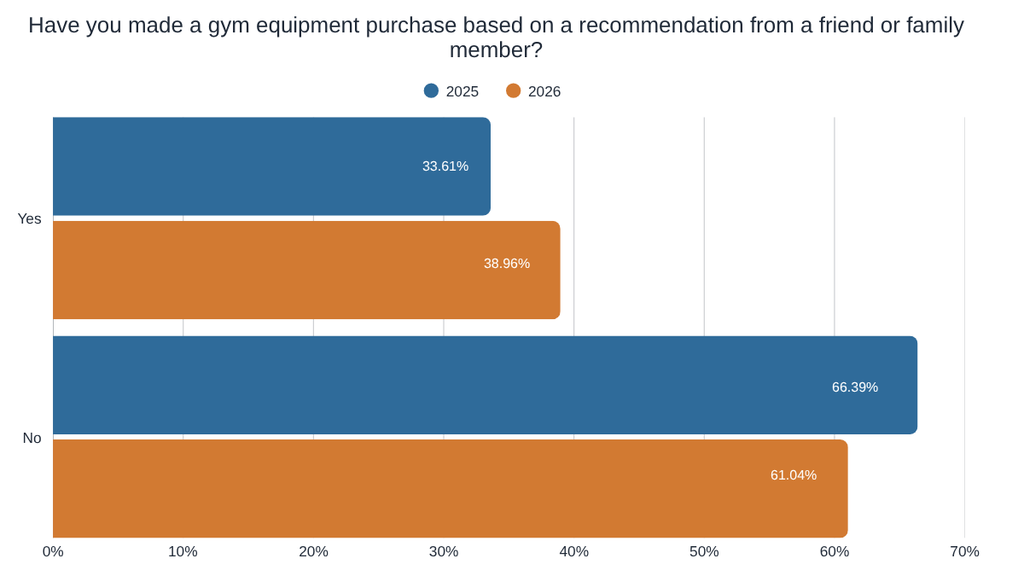
Friends and Family Recommendations (2025–2026)
Friends and family are becoming more influential in home gym purchasing decisions. The percentage of respondents who have purchased equipment based on a personal recommendation increased from 33.61% in 2025 to 38.96% in 2026. This means that word-of-mouth recommendations are playing a growing role in how home gym owners discover and purchase equipment.
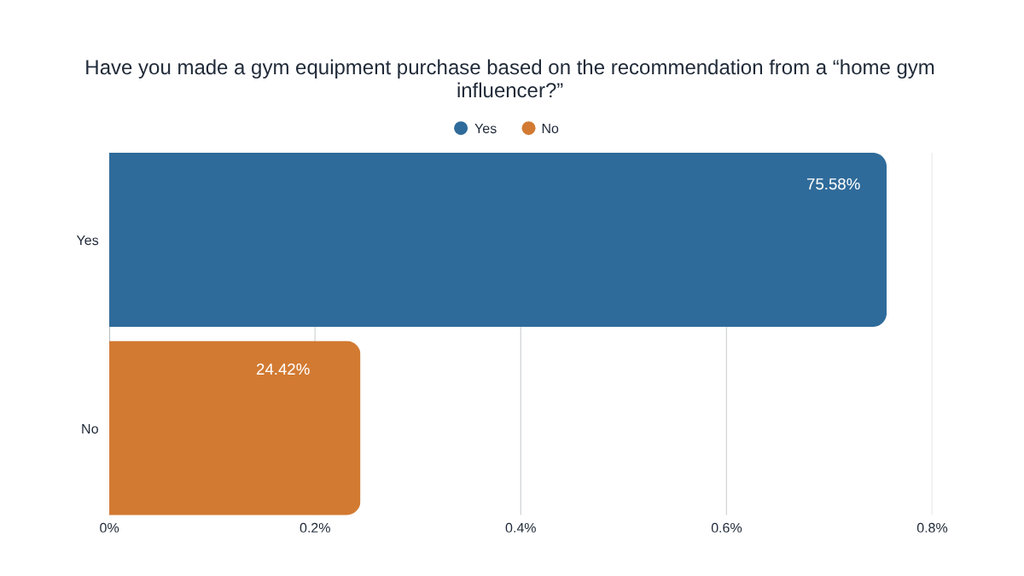
Purchases Based on Home Gym Influencers
Home gym influencers have a major impact on equipment purchasing decisions. Approximately 75.58% of respondents say they have purchased gym equipment based on an influencer’s recommendation, compared to just 24.42% who have not. This highlights the significant influence that online content creators have within the home gym community.
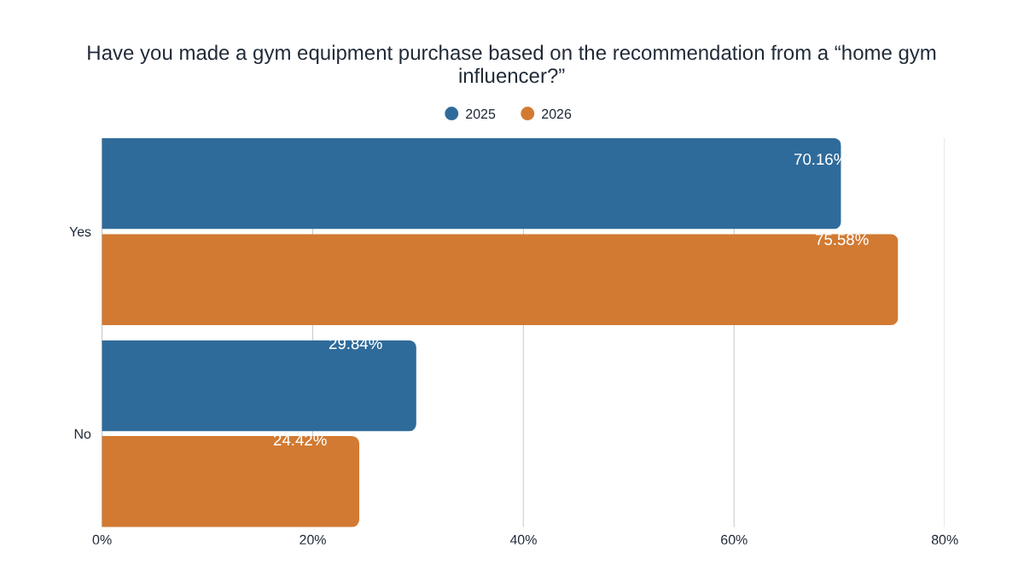
Home Gym Influencer Recommendations (2025–2026)
Home gym influencers are becoming even more influential in purchasing decisions. The percentage of respondents who have purchased equipment based on an influencer’s recommendation increased from 70.16% in 2025 to 75.58% in 2026. This means that influencers continue to play an increasingly important role in helping home gym owners discover and choose new equipment.
Opinions on Product Pre-Orders
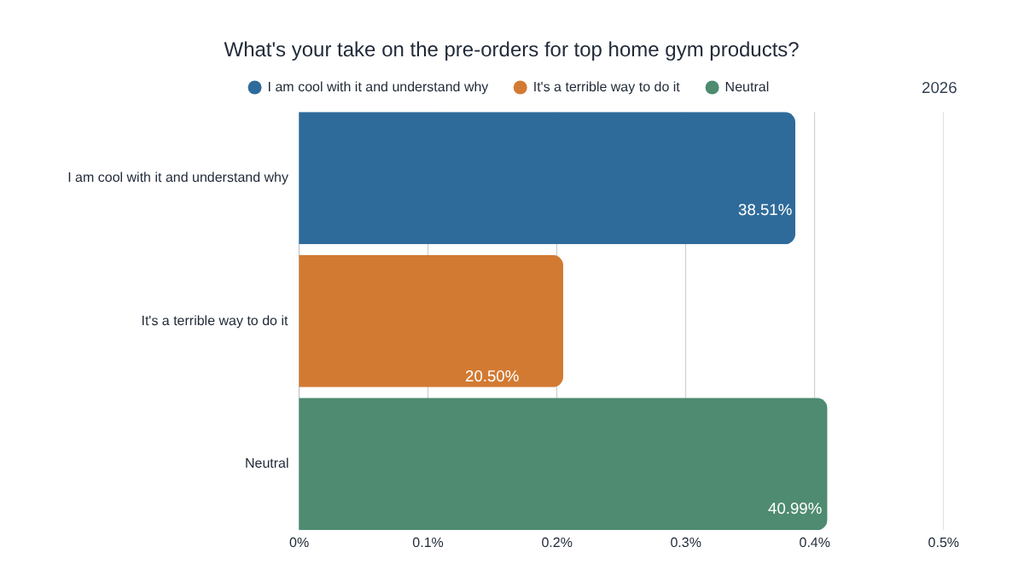
Home gym owners have mixed feelings about product pre-orders. Approximately 40.99% of respondents are neutral toward pre-orders, while 38.51% are comfortable with them and understand their purpose. Only 20.50% consider pre-orders a terrible approach. The results highlight that most home gym owners are either accepting of pre-orders or do not feel strongly about them.
Opinions on Product Pre-Orders (2025–2026)
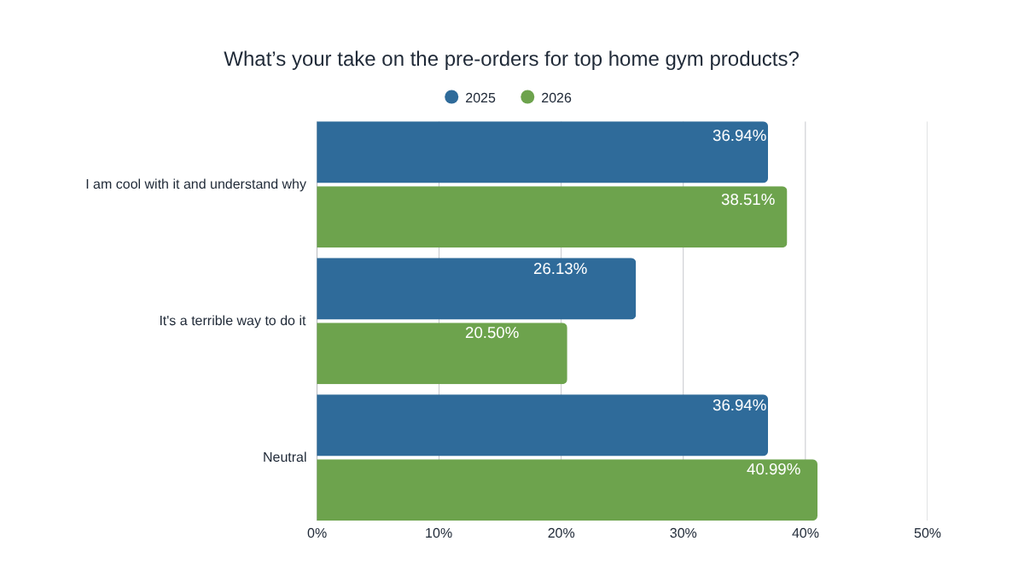
Home gym owners appear to be becoming more accepting of product pre-orders. The percentage of respondents who view pre-orders negatively decreased from 26.13% in 2025 to 20.50% in 2026. Meanwhile, neutral responses increased from 36.94% to 40.99%, and positive responses rose slightly. The data reveal that resistance to pre-orders is declining within the home gym community.
CEOs and Founders in Company Marketing
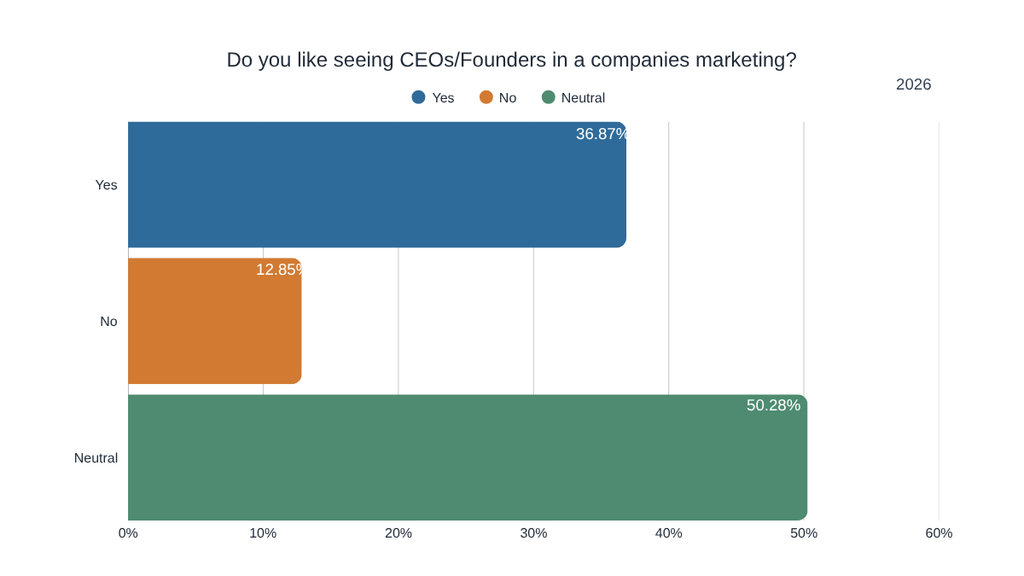
Home gym owners have mixed opinions about seeing CEOs and founders featured in company marketing. Approximately 50.28% of respondents are neutral, while 36.87% enjoy seeing company leaders involved in marketing efforts. Only 12.85% dislike this approach. The findings indicate that featuring company founders generally does not create a negative reaction, although many customers do not have a strong preference.
CEOs and Founders in Company Marketing (2025–2026)
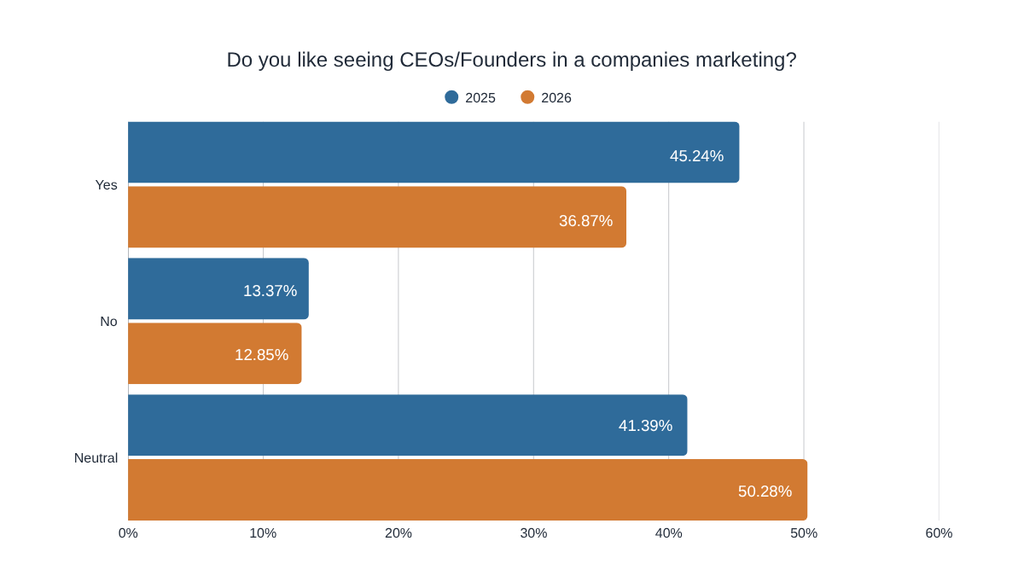
Interest in seeing CEOs and founders featured in company marketing has declined over the past year. Positive responses dropped from 45.24% in 2025 to 36.87% in 2026, while neutral responses increased from 41.39% to 50.28%. This data reveals that home gym owners are becoming more indifferent toward founder-focused marketing rather than actively disliking it.
Purchasing from Someone You’ve Met in Person
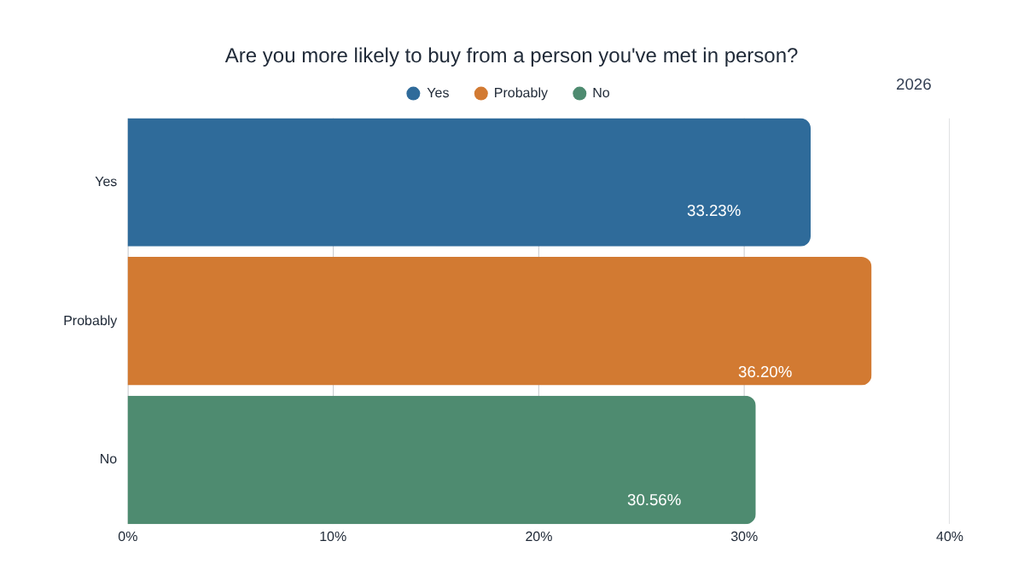
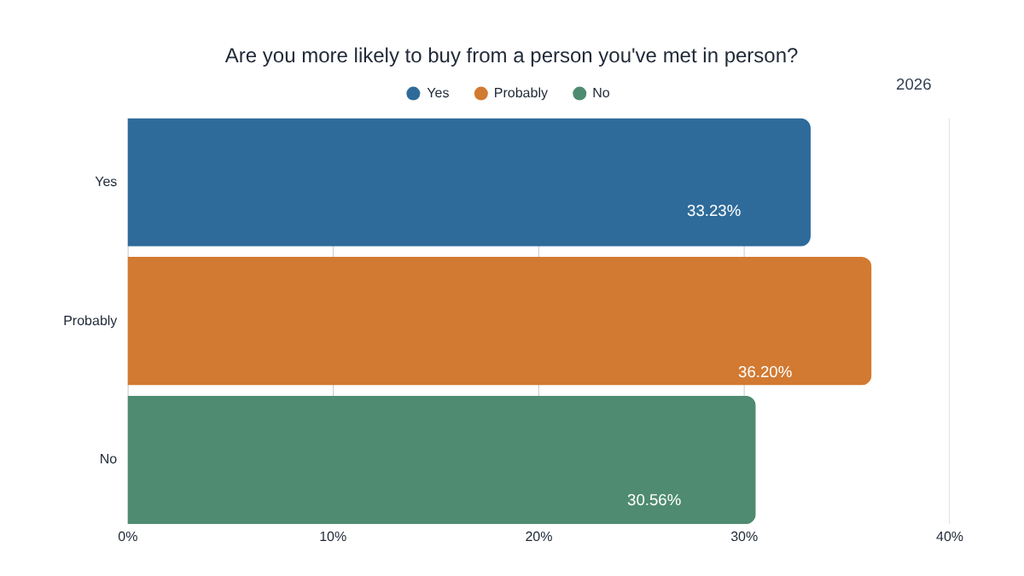
Meeting someone in person can influence purchasing decisions, but opinions remain divided. Approximately 33.23% of respondents say they are more likely to buy from someone they have met, while another 36.20% say they probably would be. Meanwhile, 30.56% say an in-person connection would not make them more likely to purchase. This poll indicates that personal relationships can provide an advantage for sellers, although they do not influence everyone.
Purchasing from Someone You’ve Met in Person (2024–2026)
The influence of in-person relationships on purchasing decisions has weakened over the past year. Respondents who say they are more likely to buy from someone they have met decreased from 42.91% in 2025 to 33.23% in 2026. Meanwhile, those who say personal meetings do not influence their decisions increased from 23.69% to 30.56%. The findings indicate that meeting a seller in person may be becoming less important to home gym customers.
First Home Gym Purchase: Barbell vs. Dumbbells
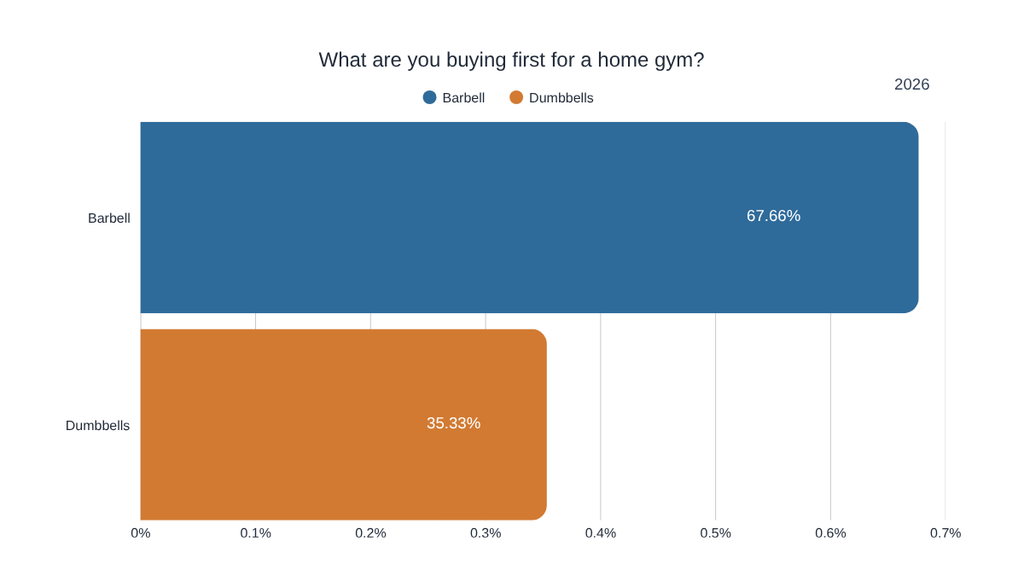
Barbells are the clear favorite when respondents are asked which piece of equipment they would purchase first for a home gym. Approximately 67.66% selected barbells, compared to 35.33% who chose dumbbells.
First Home Gym Purchase: Barbell vs. Dumbbells (2024–2026)
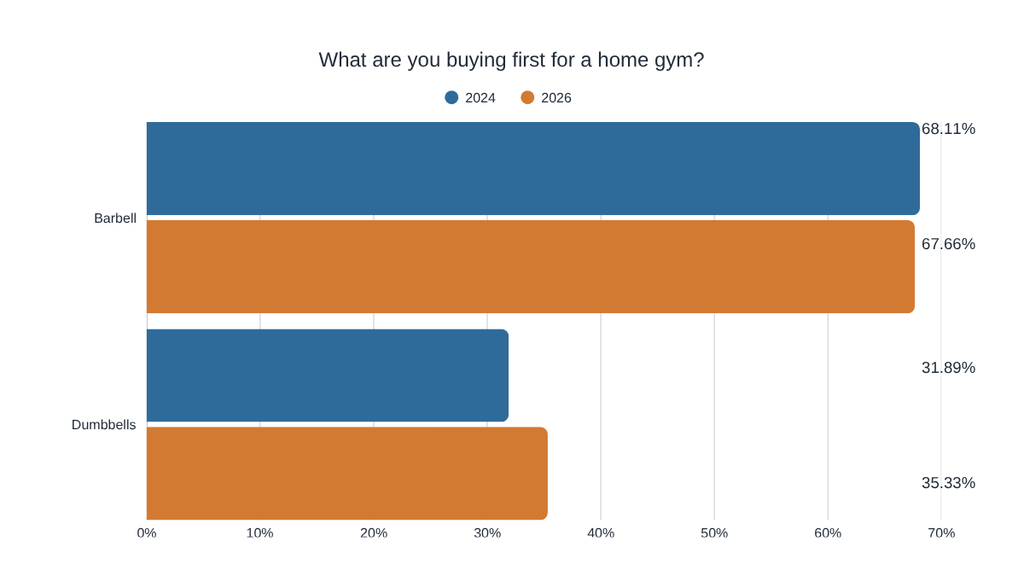
Barbells continue to dominate as the preferred first purchase for a home gym. Barbell selections remained nearly unchanged, moving from 68.11% in 2024 to 67.66% in 2026. Meanwhile, dumbbell selections increased from 31.89% to 35.33%.
Opinions on Companies That Copy Products
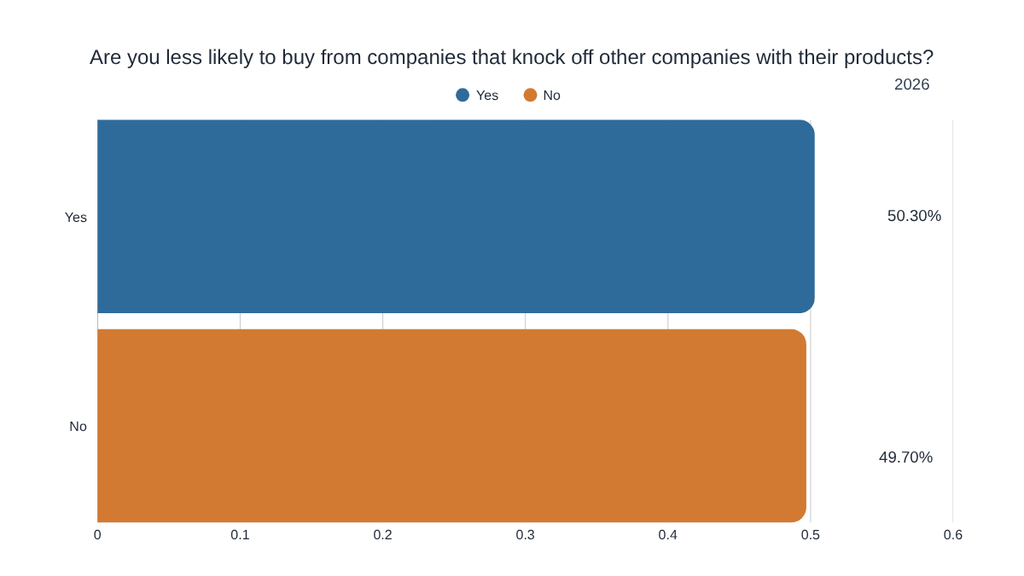
Home gym owners are almost evenly divided on whether companies that copy other brands’ products influence their purchasing decisions. Approximately 50.30% say they are less likely to purchase from companies that produce knockoff products, while 49.70% say this does not affect their likelihood of buying.
Opinions on Companies That Copy Products (2023–2026)
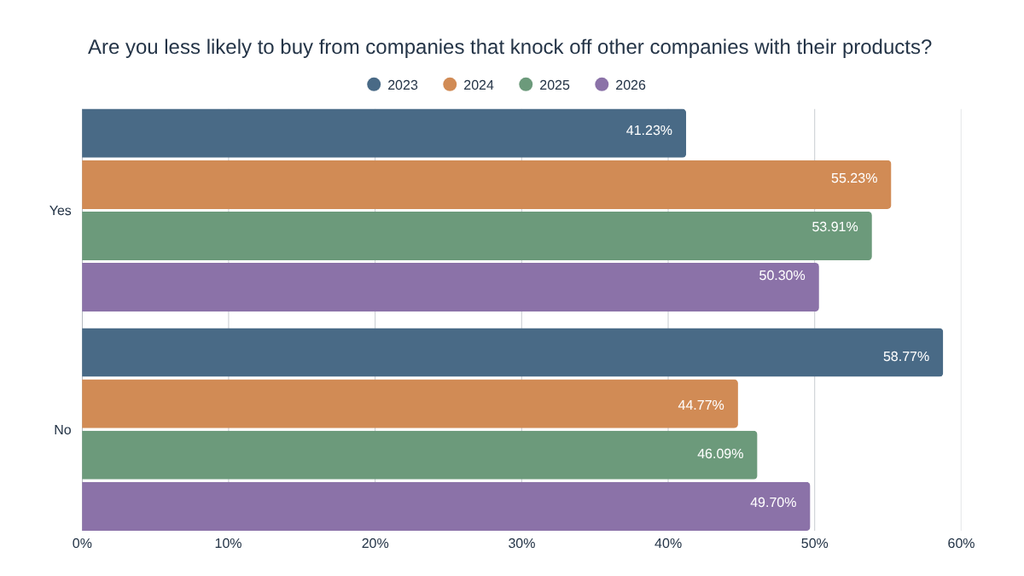
Home gym owners are becoming slightly less concerned about purchasing products from companies that copy other brands. The percentage of respondents who say knockoff products make them less likely to buy decreased from 55.23% in 2024 to 50.30% in 2026. Meanwhile, those who are not discouraged by these practices increased from 44.77% to 49.70%.
Most Desired Leg Machine
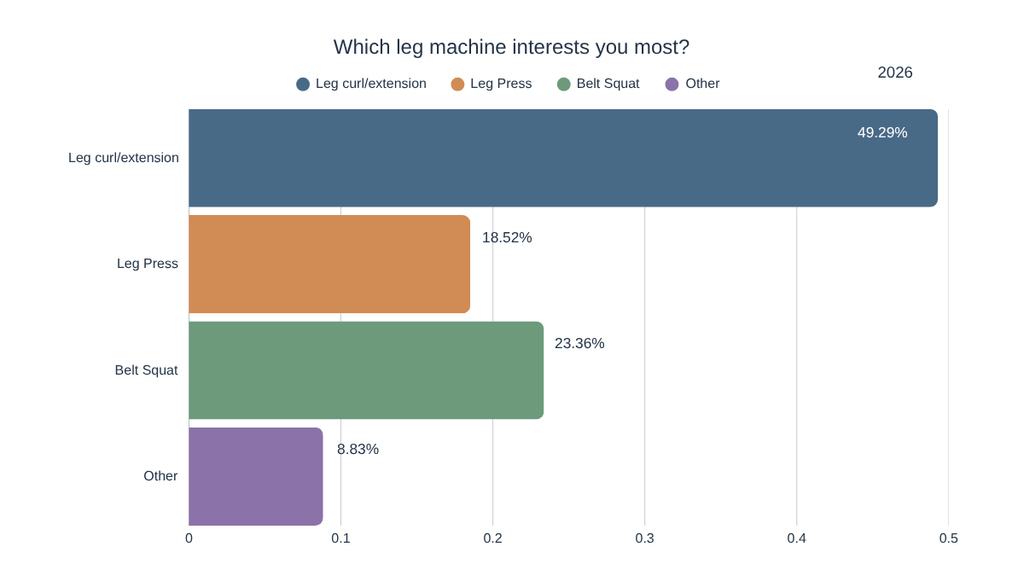
Leg curl and extension machines are the most popular leg equipment option among home gym owners, receiving 49.29% of responses. Belt squat machines follow at 23.36%, while leg presses account for 18.52% and other machines receive 8.83%.
Most Desired Leg Machine (2024–2026)
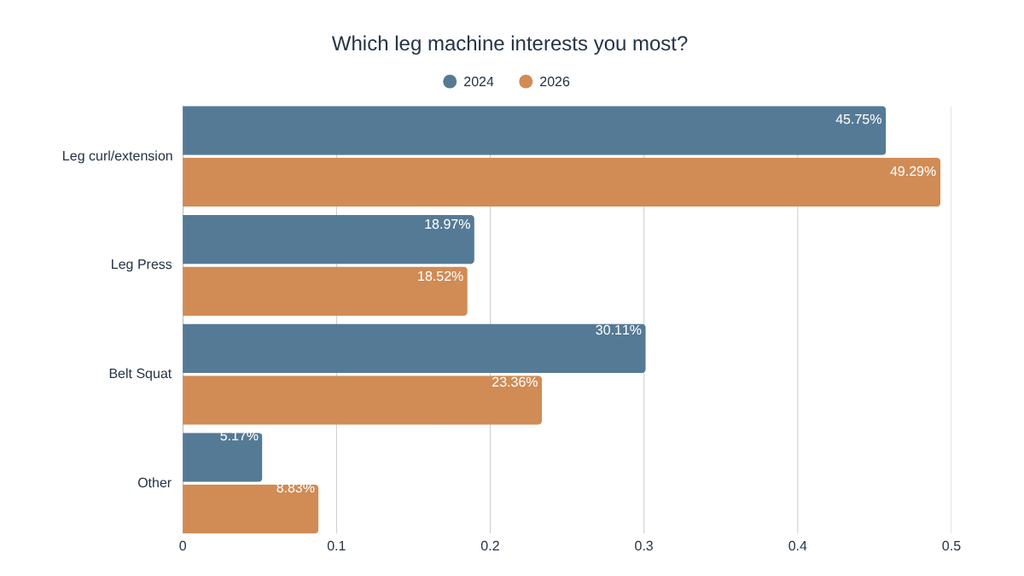
Interest in leg curl and extension machines has grown over the past two years. Their share increased from 45.75% in 2024 to 49.29% in 2026, while interest in belt squat machines declined from 30.11% to 23.36%. Leg press interest remained relatively unchanged.
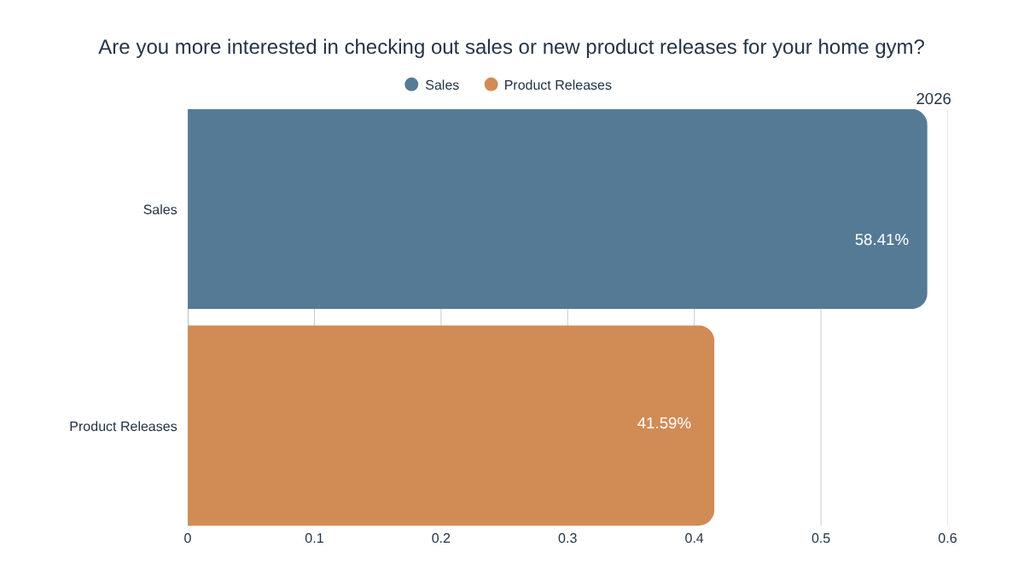
Sales vs. New Product Releases
Home gym owners are more interested in checking out equipment sales than new product releases. Approximately 58.41% of respondents prefer browsing sales, while 41.59% are more interested in seeing newly released products.
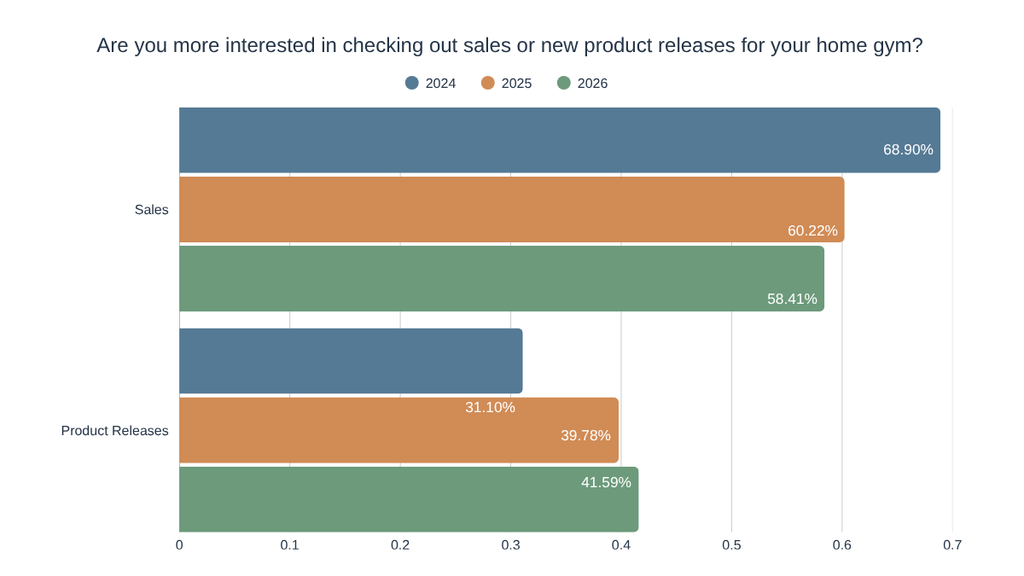
Sales vs. New Product Releases (2024–2026)
Interest in new home gym product releases has steadily increased over the past three years. The percentage of respondents who prefer checking out new products rose from 31.10% in 2024 to 41.59% in 2026, while interest in sales declined from 68.90% to 58.41%.
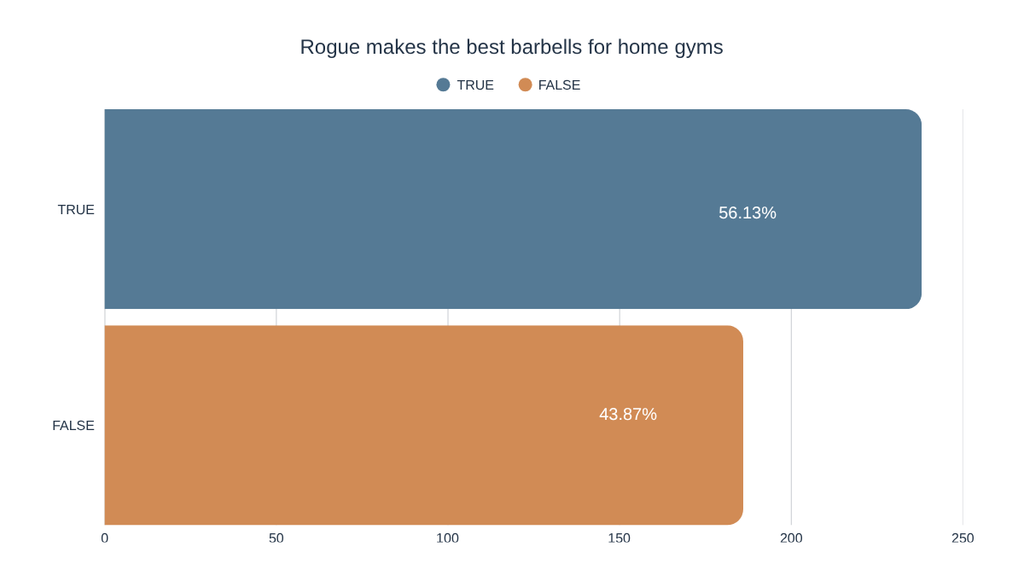
The Best Barbells for Home Gyms
In 2026, 56.13% of respondents agreed that Rogue makes the best barbells for home gyms, while 43.87% disagreed. A majority of respondents selected Rogue as the best barbell manufacturer.
Rogue Barbell Preferences (2023–2026)
The percentage of respondents who believe Rogue makes the best barbells declined from 67.90% in 2023 to 56.13% in 2026. This represents an 11.77 percentage-point decrease over the four-year period.
The Best Benches for Home Gyms
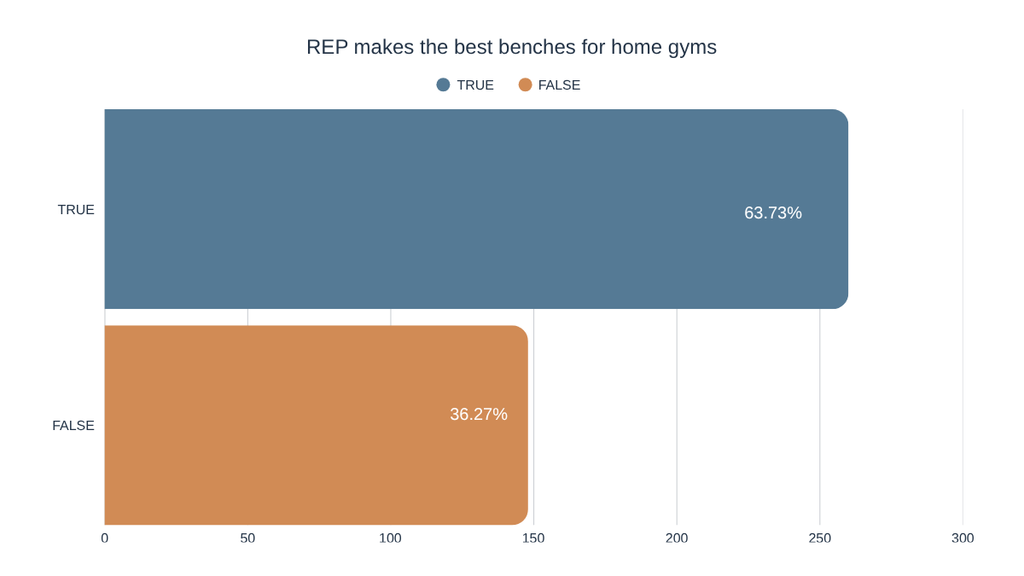
In 2026, 63.73% of respondents agreed that REP makes the best benches for home gyms, compared to 36.27% who disagreed. Nearly two-thirds of respondents selected REP as the best bench manufacturer.
Purchasing Used Gym Equipment
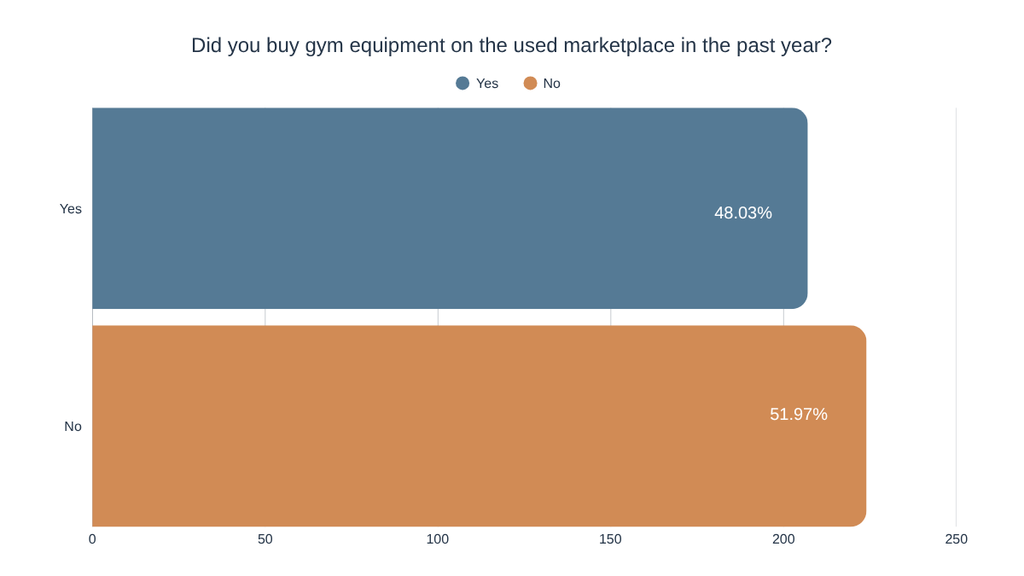
In 2026, 48.03% of respondents reported purchasing gym equipment through the used marketplace within the past year, while 51.97% had not. Respondents were nearly evenly divided between those who purchased used equipment and those who did not.
Selling Used Gym Equipment
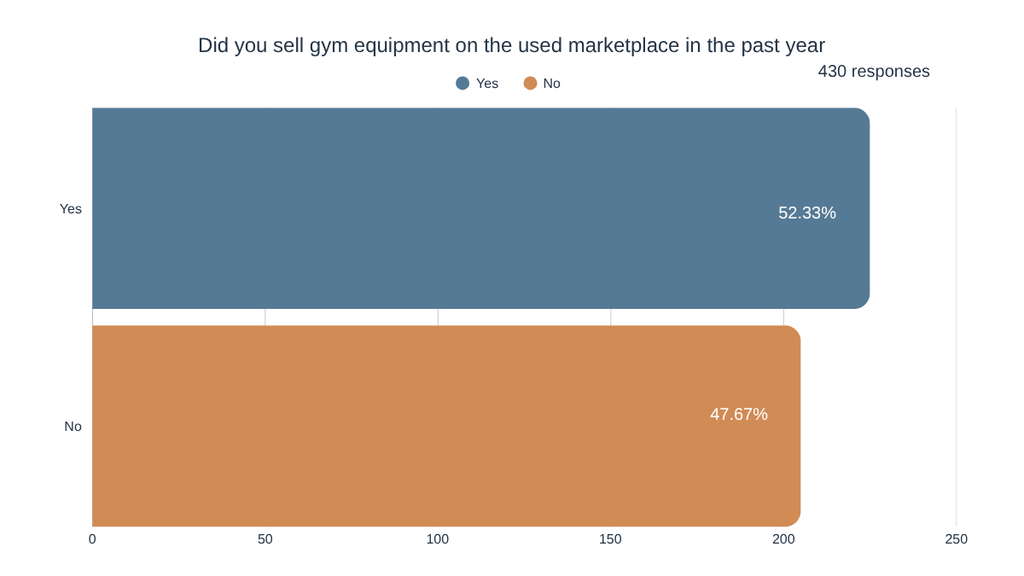
In 2026, 52.33% of respondents reported selling gym equipment through the used marketplace within the past year, while 47.67% had not. Slightly more than half of respondents participated in selling used gym equipment.
Traditional vs. Adjustable Dumbbells
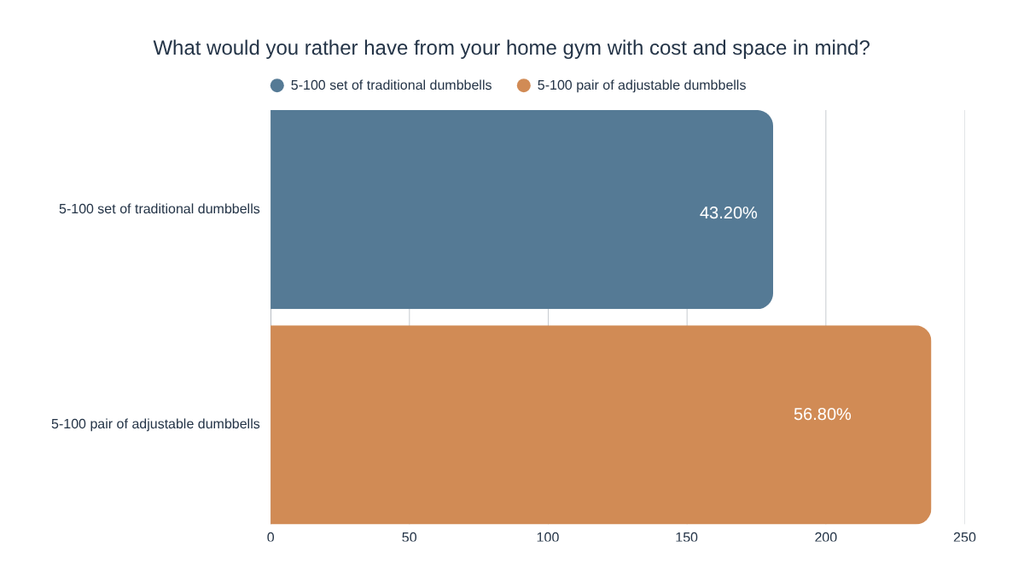
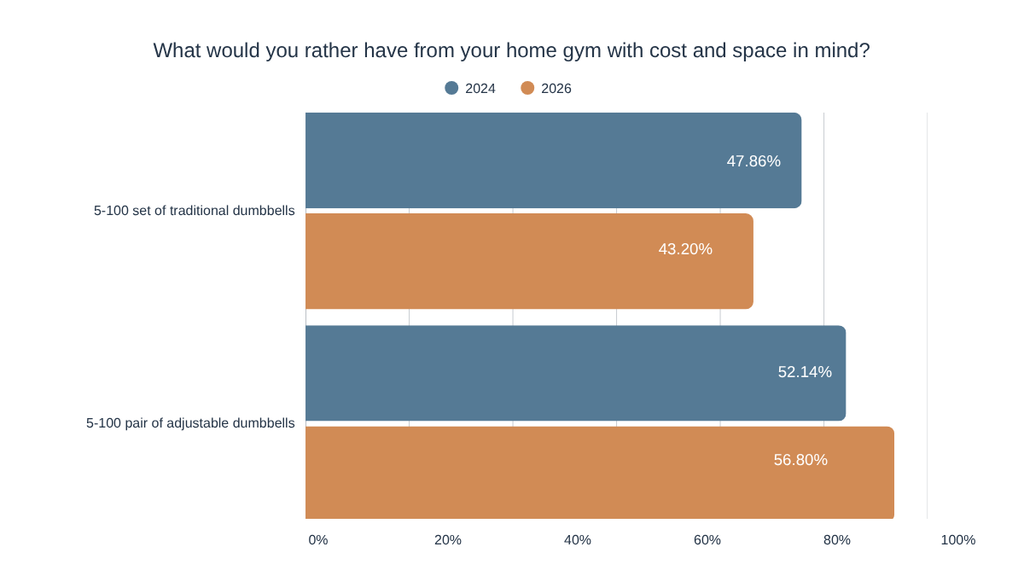
When considering cost and space, 56.80% of respondents preferred adjustable dumbbells, compared to 43.20% who preferred a traditional dumbbell set. Adjustable dumbbells held a 13.60 percentage-point advantage.
Dumbbell Preferences (2024 vs. 2026)
Preference for adjustable dumbbells increased from 52.14% in 2024 to 56.80% in 2026. Meanwhile, preference for traditional dumbbell sets decreased from 47.86% to 43.20%, representing a 4.66 percentage-point shift toward adjustable options.
Traditional vs. Adjustable Kettlebells
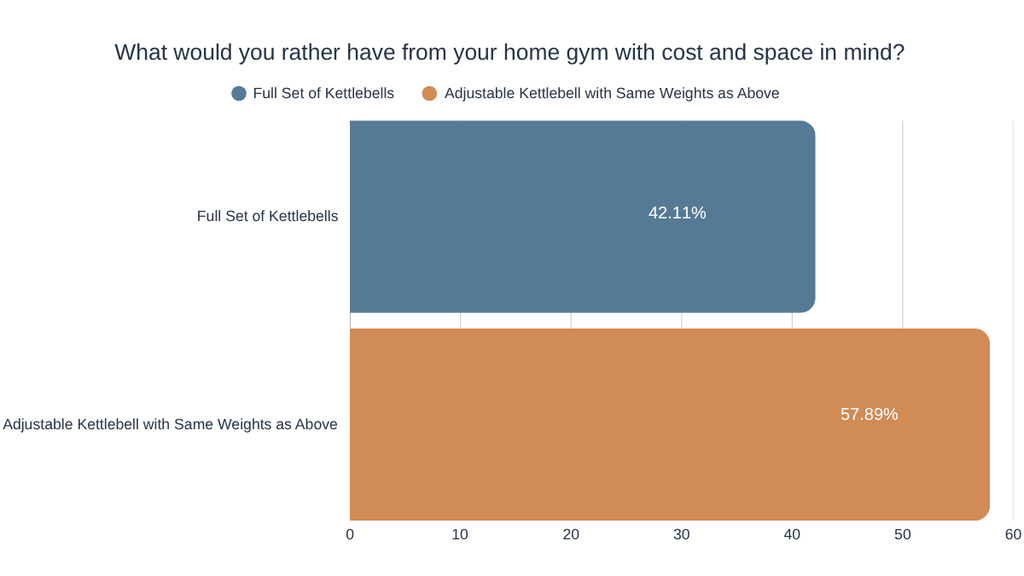
When considering cost and space, 57.89% of respondents preferred an adjustable kettlebell, while 42.11% preferred a full set of traditional kettlebells. Adjustable kettlebells were favored by a 15.78 percentage-point margin.
Kettlebell Preferences (2024 vs. 2026)
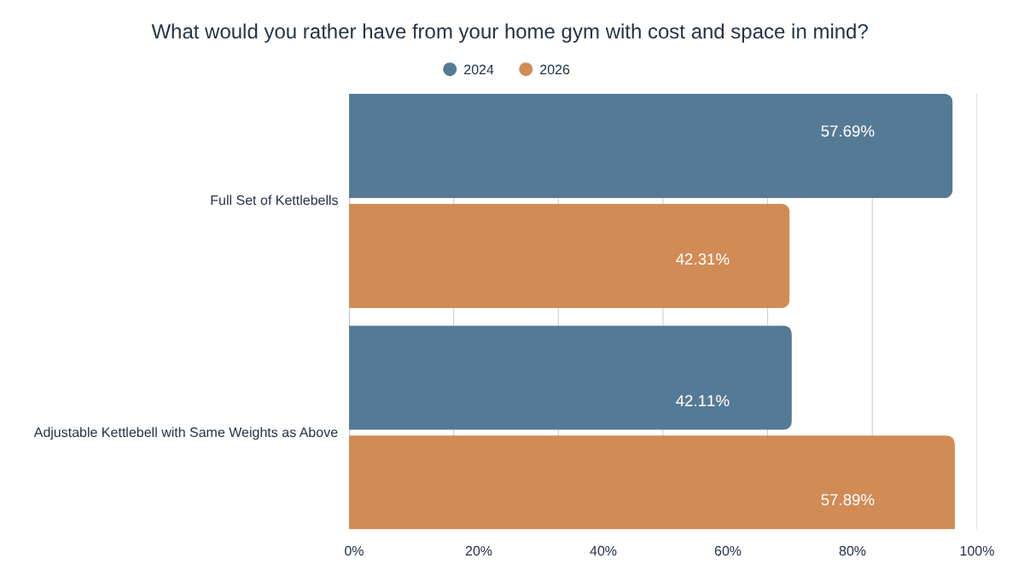
Preference for adjustable kettlebells increased from 42.11% in 2024 to 57.89% in 2026. Meanwhile, preference for traditional kettlebell sets decreased from 57.69% to 42.31%, showing a reversal in the preferred equipment type between the two years.
Number of Barbells Owned
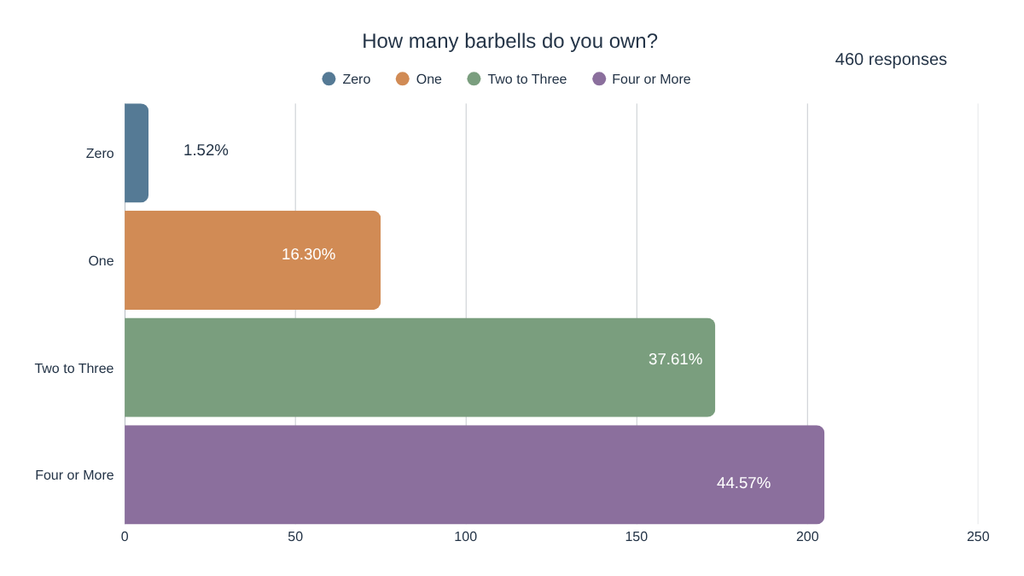
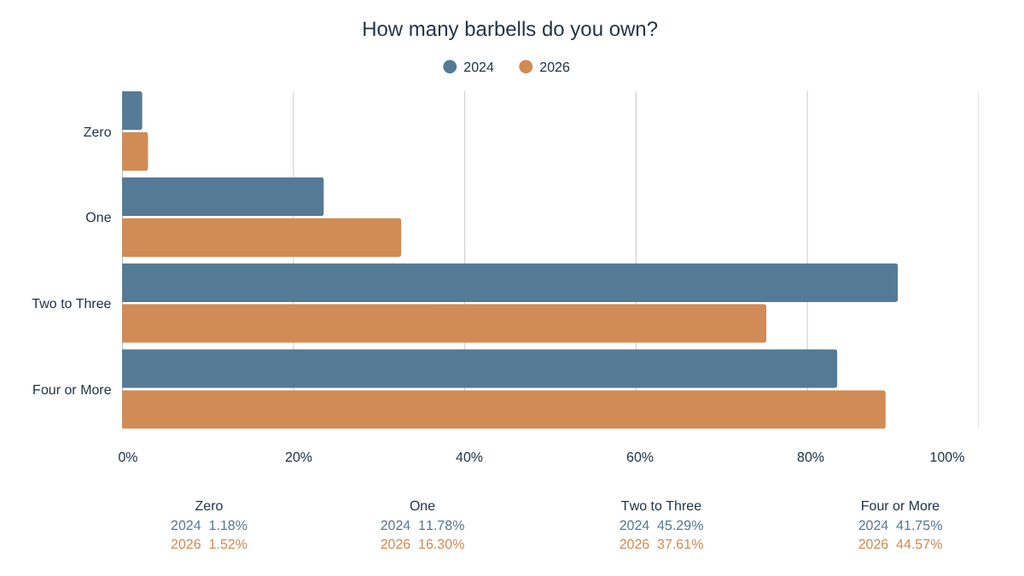
In 2026, 44.57% of respondents owned four or more barbells, while 37.61% owned two to three. Another 16.30% owned one barbell, and just 1.52% owned none. Overall, 82.18% of respondents owned at least two barbells.
Barbell Ownership (2024 vs. 2026)
The percentage of respondents owning four or more barbells increased from 41.75% in 2024 to 44.57% in 2026. Ownership of two to three barbells decreased from 45.29% to 37.61%, while single-barbell ownership increased from 11.78% to 16.30%.
Primary Reasons for Owning Multiple Barbells
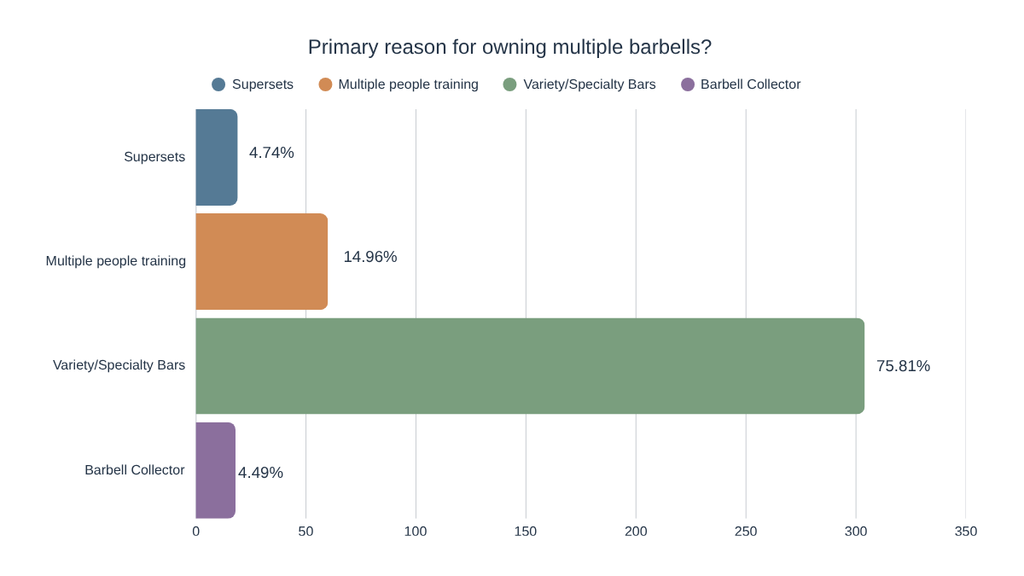
In 2026, 75.81% of respondents identified variety or specialty bars as their primary reason for owning multiple barbells. Another 14.96% cited multiple people training, while 4.74% selected supersets and 4.49% identified themselves as barbell collectors.
Reasons for Owning Multiple Barbells (2024 vs. 2026)
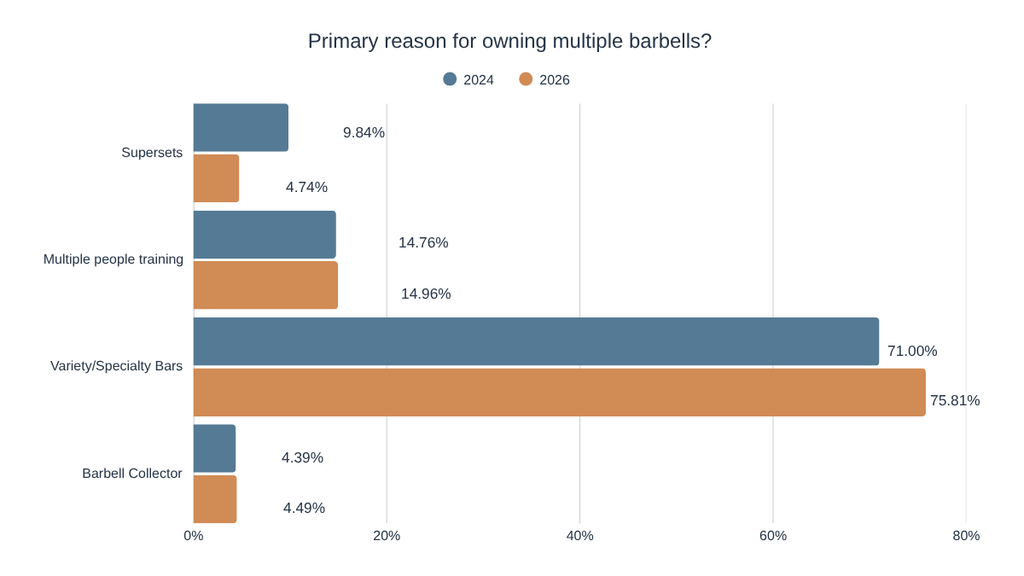
Variety and specialty bars remained the leading reason for owning multiple barbells, increasing from 71.00% in 2024 to 75.81% in 2026. Supersets declined from 9.84% to 4.74%, while multiple-person training and barbell collecting remained relatively stable.
Running a Business From a Home Gym
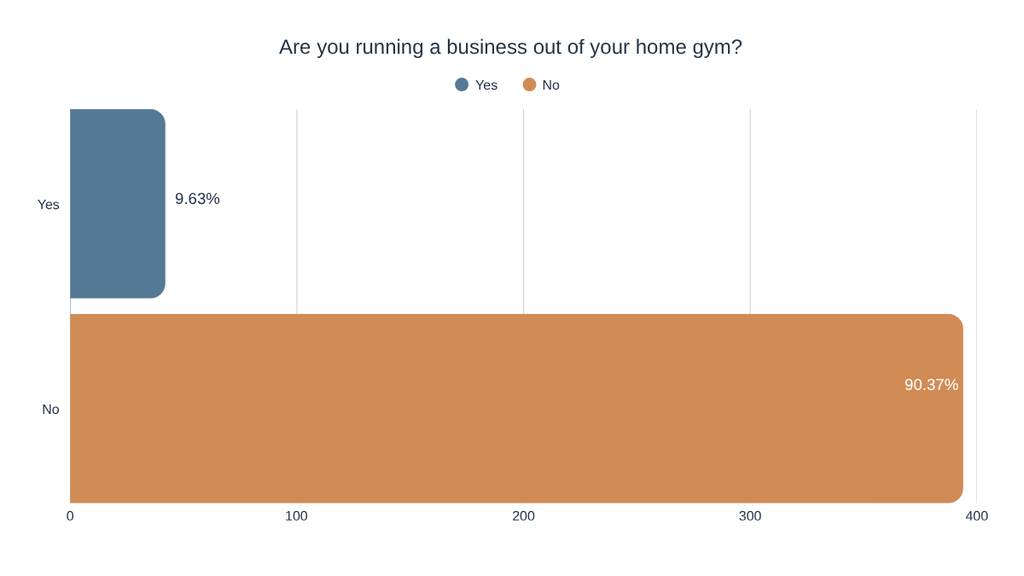
In 2026, 9.63% of respondents reported operating a business out of their home gym, while 90.37% did not. Fewer than one in ten respondents used their home gym for business operations.
Lastly, a simple disclaimer about who is answering these questions:
These results come from story polls on the @garagegymexperiment Instagram account, where I’ve been running surveys since 2019. I’d describe this group as some of the most involved home gym owners in the space. They don’t represent the entire world, just this passionate community, so please keep that in mind when reading the data. The group will likely change up from year to year slightly as well.