Introduction
This is our 2022 yearly wrap-up of survey results. We’ve taken the most “relevant” pieces of data and summarized them into one blog post/podcast episode. All survey results can be found here.
Within this summary, you’ll find:
- Who is Answering These Questions?
- Habits/Other Respondent Info
- Issues that Home Gym Owners Face
- Equipment Owned
- What is the Space Being Used?
- Barbell Data
- Rack Data
- Attachment Data
- Bench Data
- Additional Equipment Preferences
- Cardio Equipment Analysis
- Have you Heard of these Companies?
- Other Interesting Survey Results
Some additional info about the survey includes:
- Most of the analysis below is based on data via the Instagram Story tool, where each question is live for 24 hours. There are also some limitations to this method. For example, only 4 multiple-choice options are using this feature. However, it’s been an effective way to get lots of responses, and many enjoy doing the surveys in this fashion each week.
- These surveys are pretty casual but deliver many key insights into those building out their home gyms. Many companies are using this data to develop products and strategies for this growing market.
- Thousands answered each of these questions.
Additional analysis can be listened on Spotify, Apple, Garage Gym Radio or wherever you listen to podcasts.
Who is Answering these Questions?
As previously mentioned, these questions were answered on the Garage Gym Experiment Instagram Account, which includes an audience of about 80% male and 77% between ages 25 and 44.
- In addition, it’s important to note that males in this age range are the most active on the account and more likely to listen to the podcast.
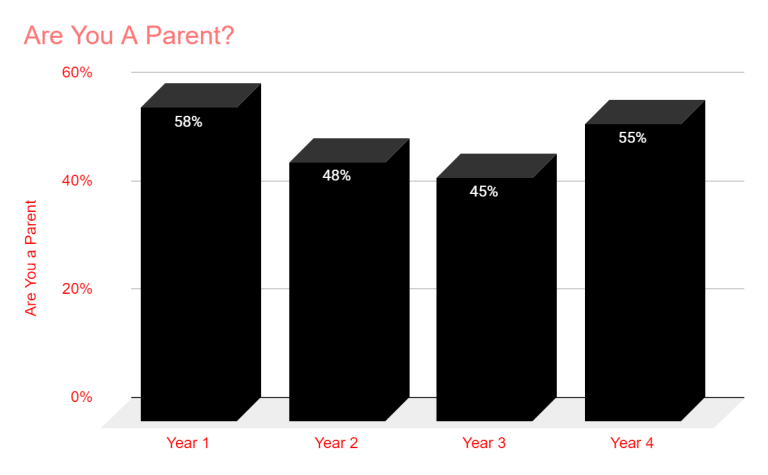
55% are parents.
This is up slightly from the past two years when we saw more people begin home gyms during pandemic spikes. I imagine this will begin to tinker back up to what we saw back in 2019.
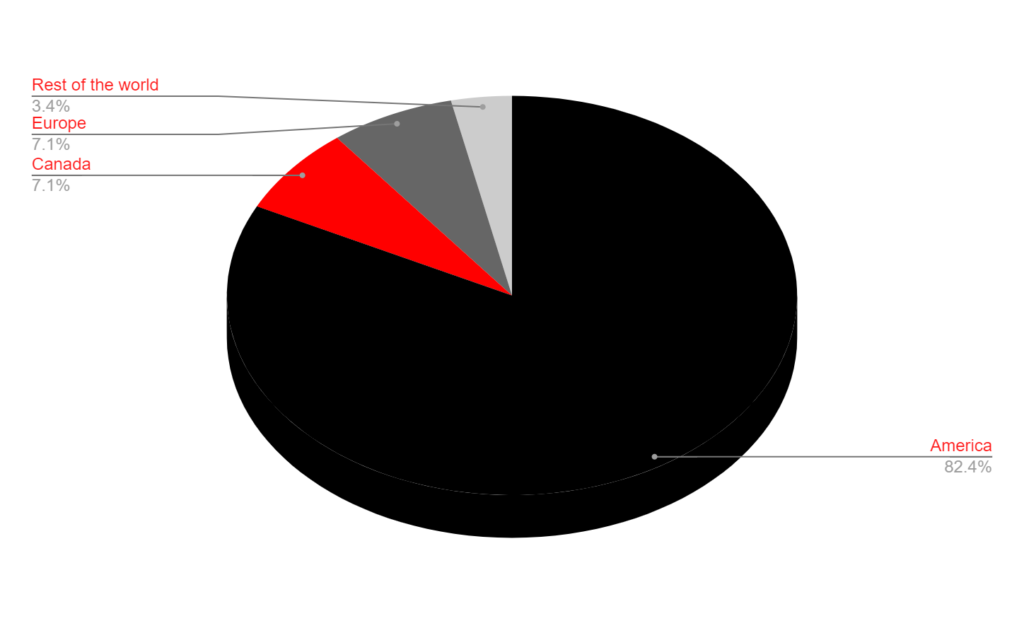
Northat America makes up about 90% of those answering the surveys. To get specific it’s 82% America, 7% Canada, 7% Europe, and 3% rest of the world.
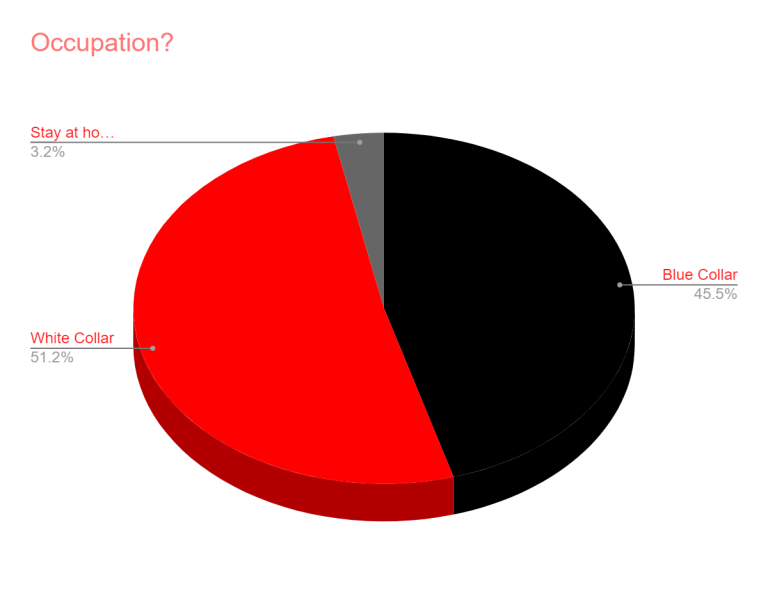
There were slightly more “white collar” workers than “blue collar” ones this time around. Last year, the figures were exactly the same.
Military, nurses, and coaches all reached out about this question…. So keep that in mind
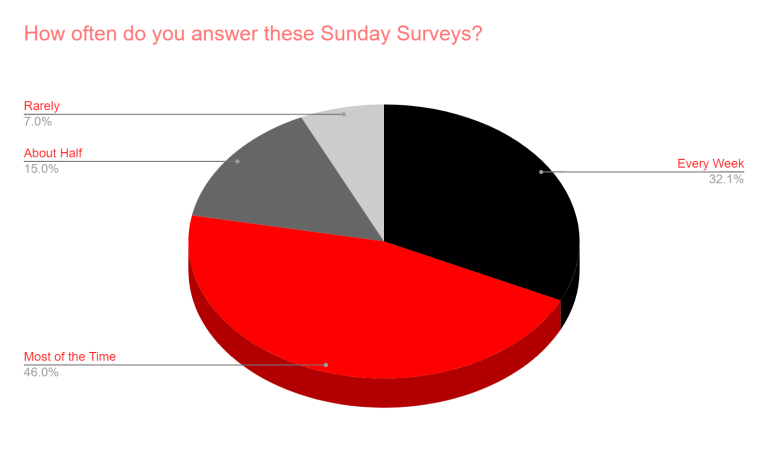
About 78% of those answering this survey are answering on a regular basis.
Based on feedback from the community, this is something many really enjoy.
Many have a history of playing sports.
71% played high school sports, and 27% college.
88% of those answering these questions use their home gym as their primary gym option.
This is up from 81% the year before.
The garage is the most popular spot for putting in a home gym.
About 2 in 3 have a “garage gym,” with 20% in the basement. 8% are in another room in the house, and 8% have it elsewhere.
While 64% have it in their garage, only 44% say it would be in their dream world (separate building, basement, etc would be better options).

Over half said they did not associate themselves with any strength sport. Of those that did, powerlifting was the top choice, with bodybuilding a relatively close second.
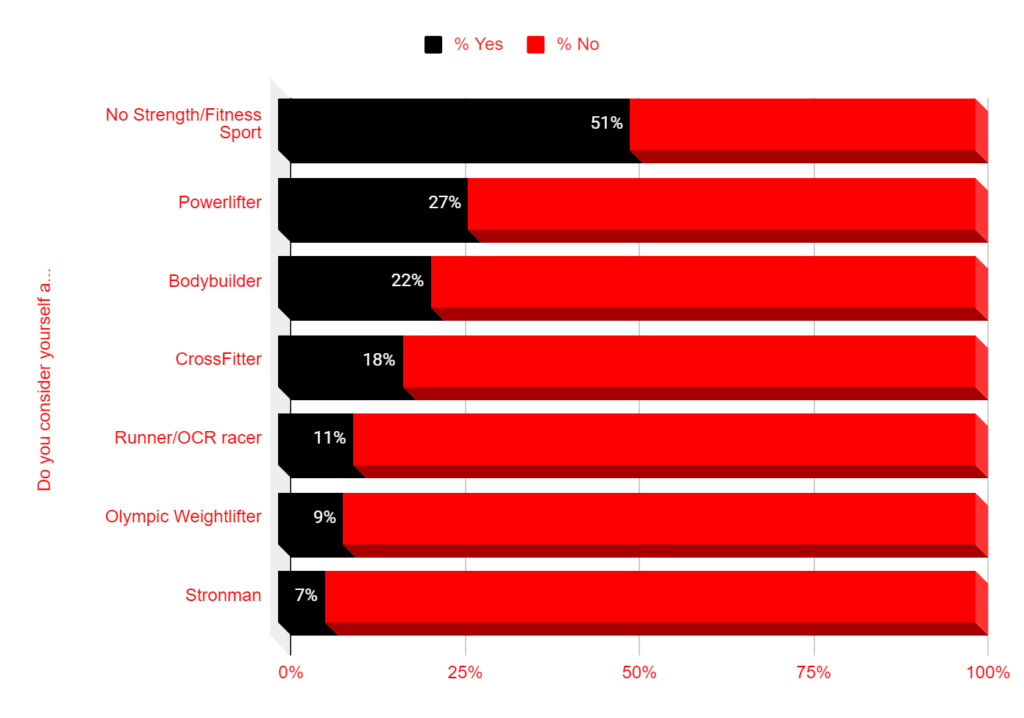
64% would rather improve their bicep size vs. 36% mile time
While this seems like a somewhat silly point of data, it does help you understand who is answering these questions.
Habits/Other Respondent Info
Spending varied. Some spent a lot. Others, not so much.
36% stated they spent less than $500, while 24% spent more than $1,500. About 40% paid in between the smallest and top figure when asked how much they spent on their home gym this year.

56% look on the used marketplace for gym equipment weekly and about 44% have made a recent purchase on the used marketplace.
About a quarter have made multiple used marketplace purchases within the past 5 months. About 56% have purchased zero within this “buy range.”

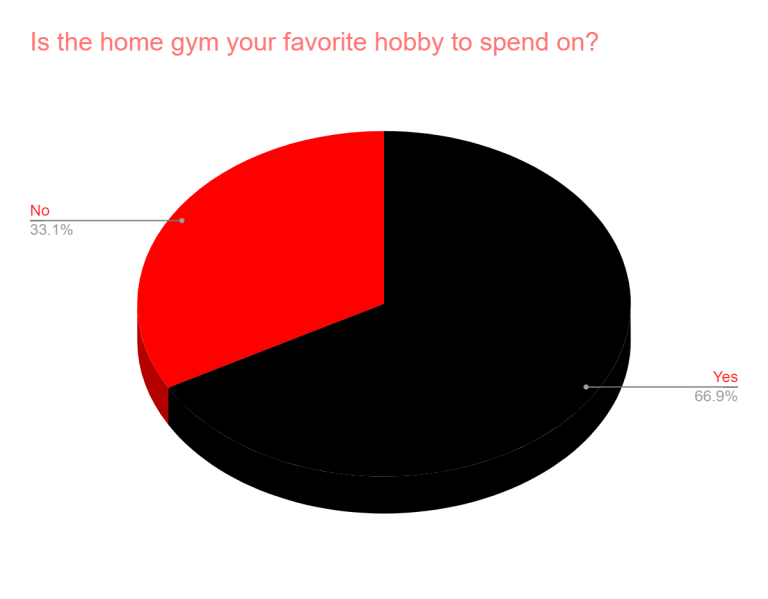
A whopping 67% say it is indeed their favorite hobby to spend money on.
Many love the process of building out their home gym. I’d compare this to how many others enjoy building a man cave or outdoor garden.
What are the #1, #2, and #3 reasons you train? Physical health, mental health, looking good, and for a competition were asked about. That is also the order of importance.

Most have some sort of programming guide (paid or free).
Over 7 out of 10 typically follow a workout program, just over 4 out of 10 pay for programming, and just under 1 out of 10 have a 1:1 coach. These numbers are pretty similar to what we saw in 2021.

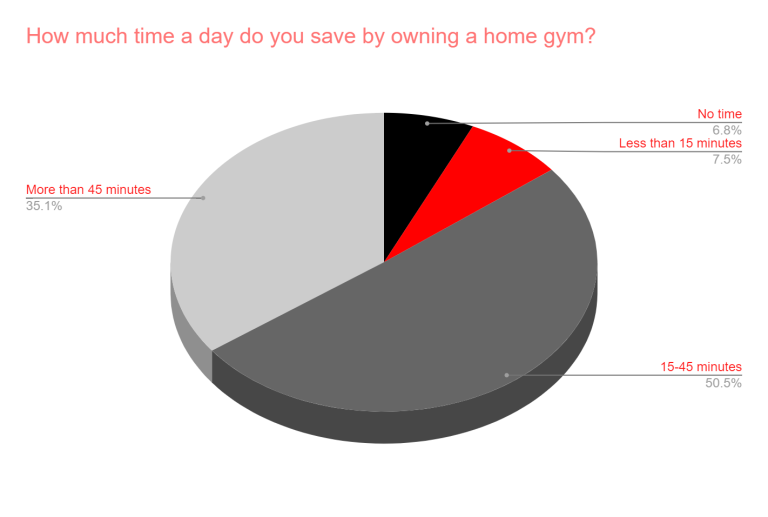
82% believe that saving time is more important than saving money when it comes to owning a home gym.
While the majority are saying 15-45 minutes are saved, a massive 35% save more than 45 minutes a day. Only about 14% say they save less than 15 minutes a day by owning their own gym.
Issues that Home Gym Owners Face
The Two Biggest Issues remain unchanged from the year before, which are the price of obtaining more equipment and the lack of space for the home gym.
Only 10% (price) and 13% (space) said that there was no issue with either of these potential problems. The third largest issue was ceiling height, where 31% said it was not an issue.
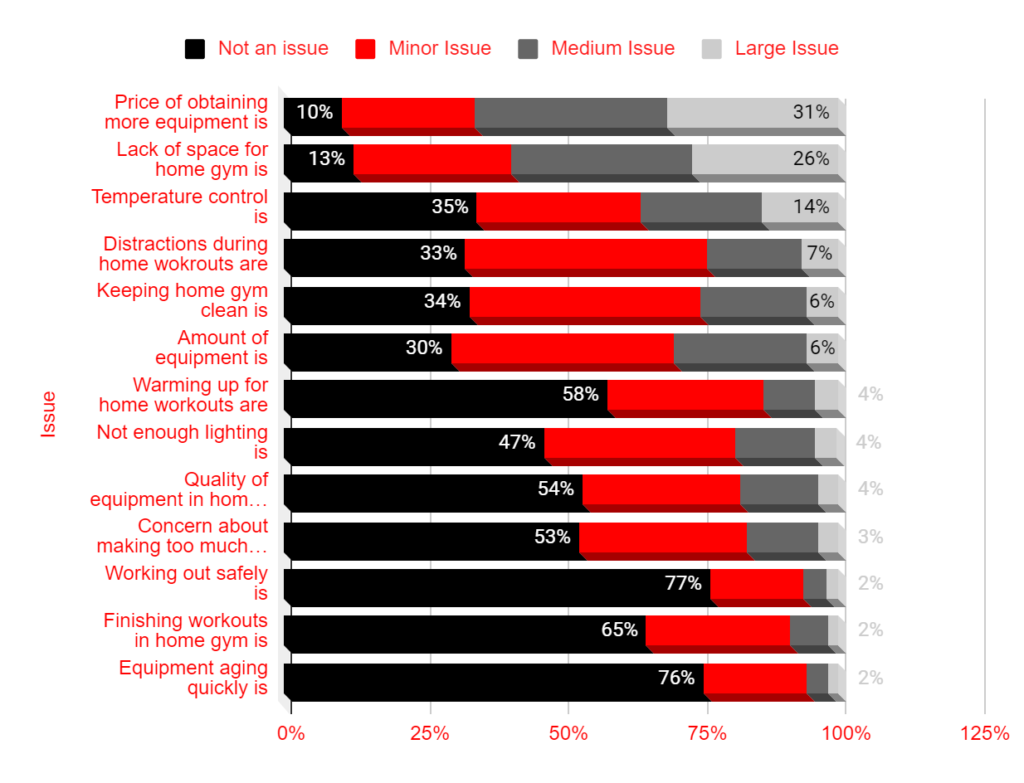
Temperature Control was the #4 issue and cold winters are a bigger problem than hot summers for 2/3.

Results are nearly identical no matter what time a year this question is asked. Cold winters are worse for most.

What is Owned?
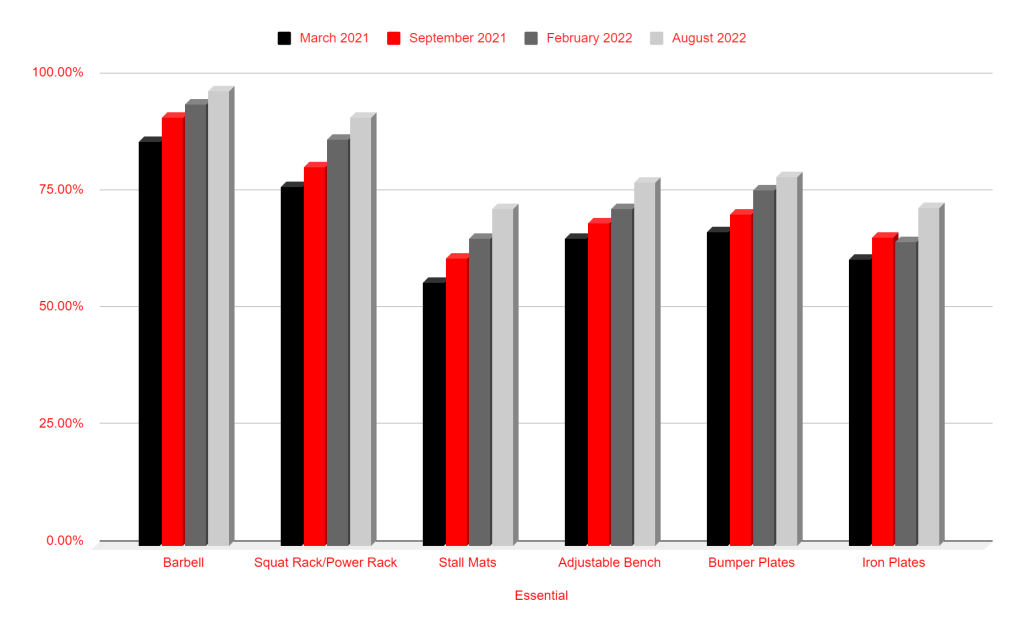
Below is a look at the percentage owned by those answering the survey questions. As you would expect, barbells, dumbbells, and a rack are at the top of the list (all over 90% owning), while the larger strength machines are at the bottom (under 20% owning).

Trend #1 with this data is that “Essentials” are Going Up
With about 1.5 years of data on this, we’re seeing that those owning the “essentials of the home gym” are going up steadily each time.
For example, the barbell went from 86% in March 2021 to 91% in September 2021, 94% in February 2022, and 97% in August 2022.
19% now own a functional trainer, and the data states that it is the most popular specialized strength machine.

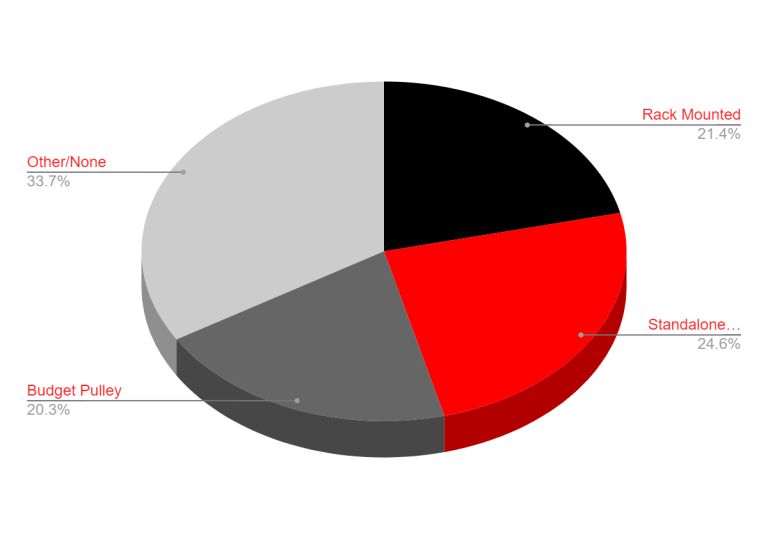
What Type of Pulley System do you have in your Home Gym? This was a very spread-out response. At the same time, 34% have none/other, and all other options received between 20% and 25% of the votes, with standalone being the most popular by a small margin.
Nearly 7/10 own Horse Stall Mats
The most popular flooring option is easily to stall mats, which is no surprise.

Home Gym Space
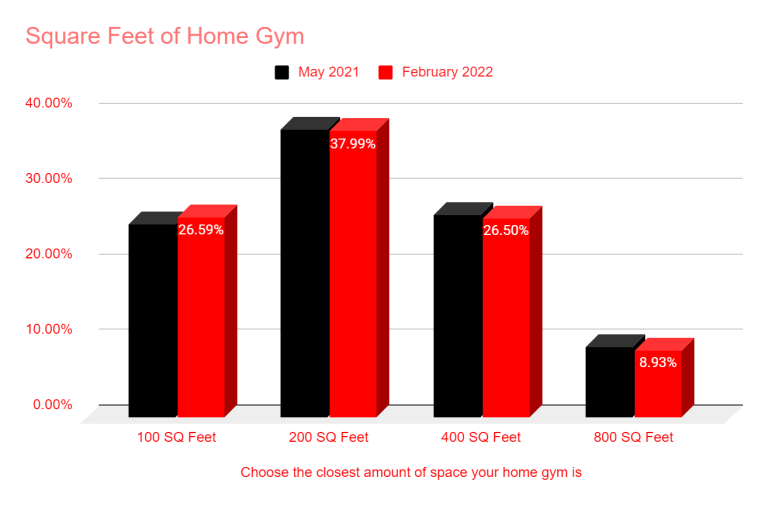
About 65% are working with about 200 square feet or less, which is a number that hasn’t changed much over the past year.
With 100, 200, 400, and 800 square feet options, 200 square feet had the highest response with 38% of total votes, which is about the size of a single car or half of a traditional garage. 100 and 400 square feet each had less than 27% of votes with only 9% having 800 square feet or more.
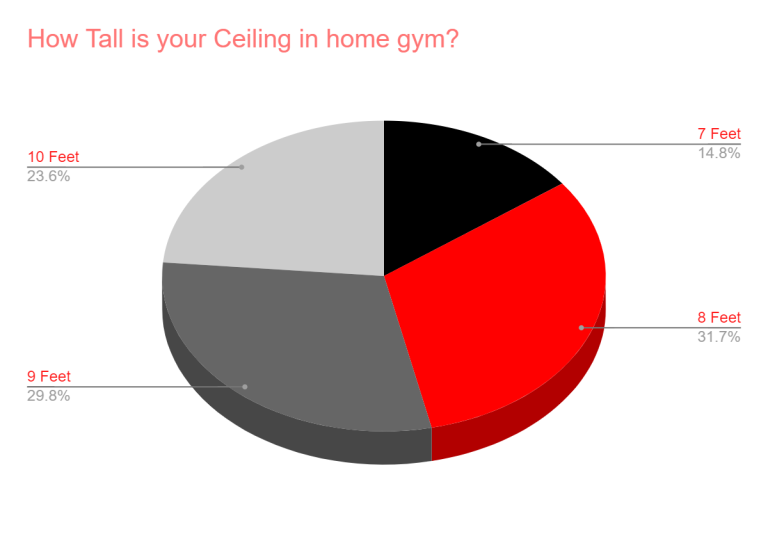
Ceiling height is a struggle for a good amount.
About 15% have around 7 feet or less. These are likely people in a basement. Issues include lifting overhead, pull-ups, storing barbells vertically etc.
About 62% have around 8 or 9 feet. Less than a quarter have something around 10 feet or more. Therefore a good amount of people cannot just go out and buy any piece of equipment they want.
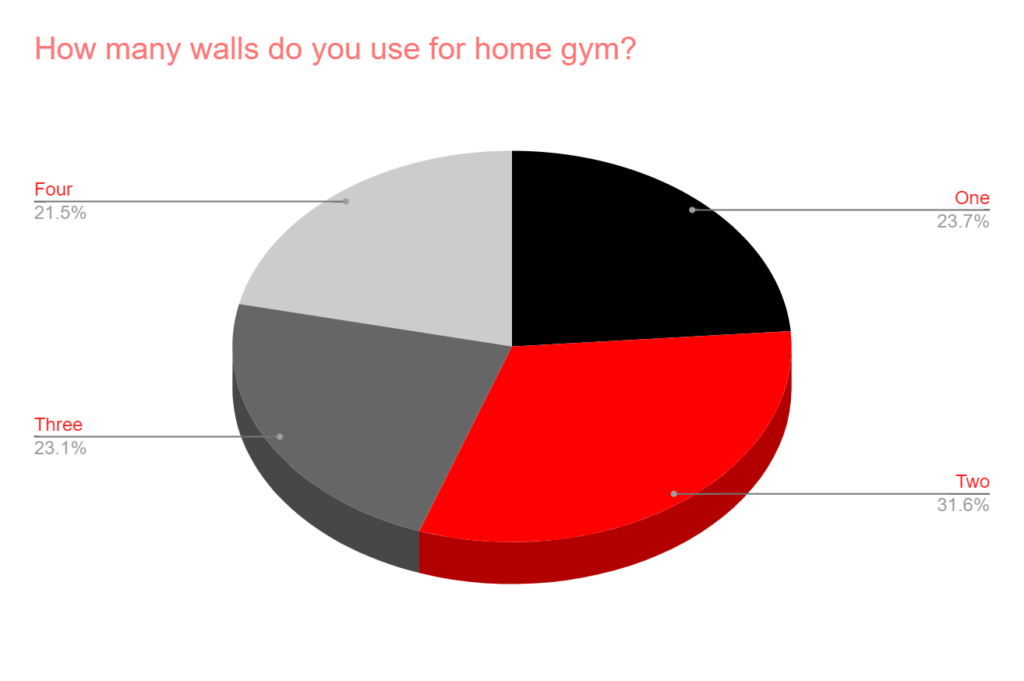
While the majority are only using one or two walls, there are still about 45% that are utilizing 3 or 4 walls.
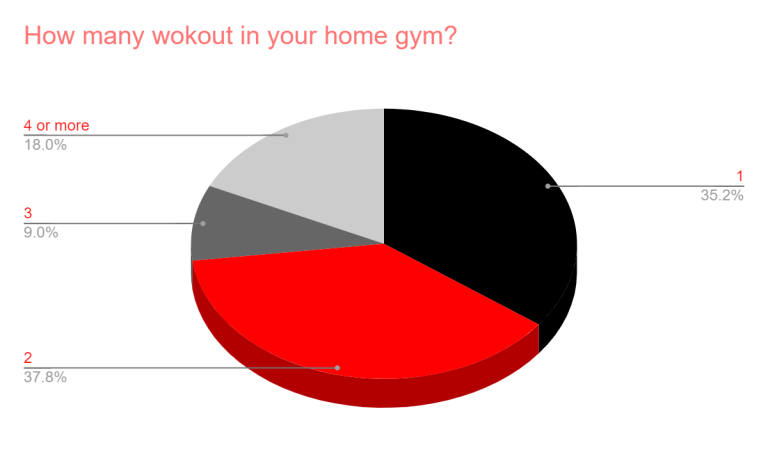
Only 35% have a single person utilizing the home gym. Thus, when people are buying gym equipment for their home gym, it’s not necessarily just for them.
Barbell Data
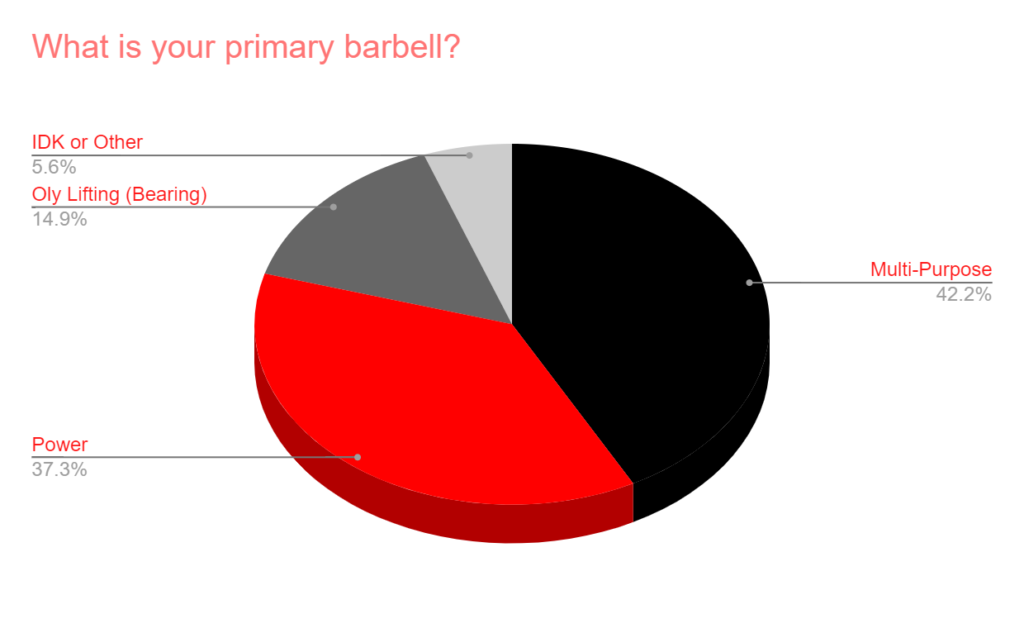
Multi-Purpose barely beat out the Power Bar as the #1 option when asked what their primary barbell is.
Both MP and PB are up from last year with bearing bars down from 23% the year before.
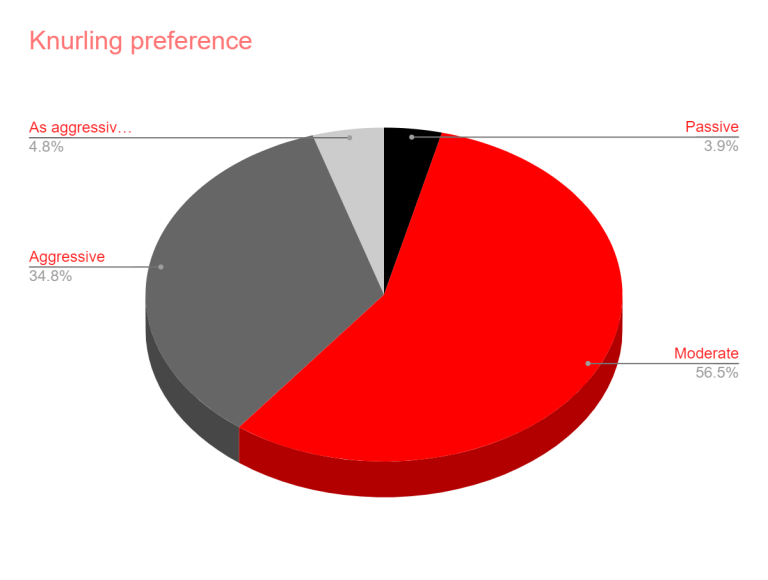
3 out of 5 prefer a center knurl, with 9% not knowing what they want.
The results here were VERY SIMILAR to what we saw in 2021.
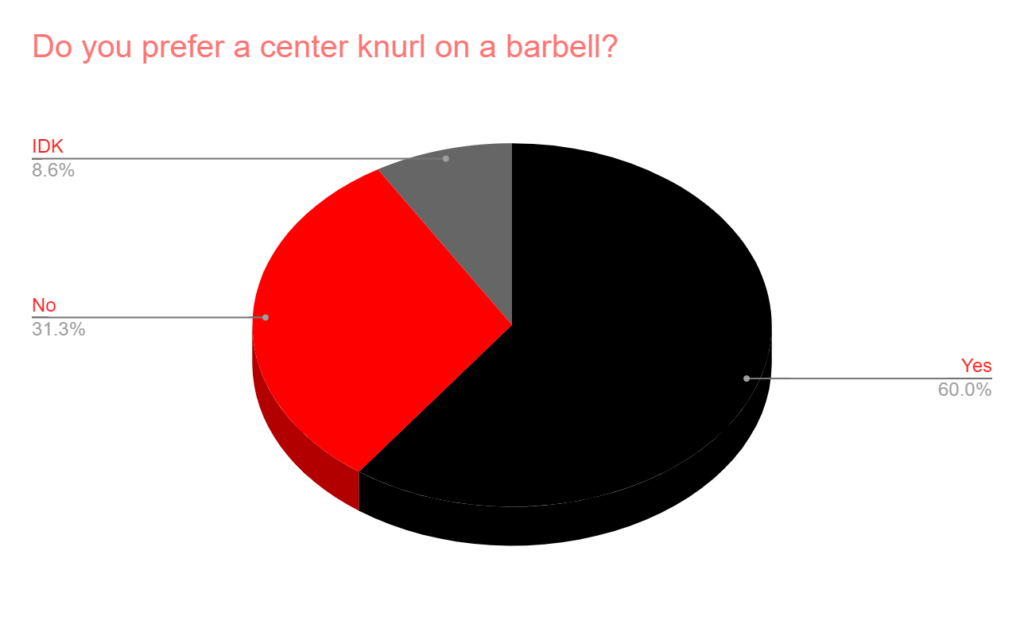
57% prefer a “moderate” knurl preference, with about 35% wanting it to be aggressive.
With 43% voting “high interest,” the SSB was easily the one that had the most “high interest.”
| Specialty Bar | High | Medium | Low | IDK What That Is |
| Safety Squat Bar | 43.25% | 28.00% | 27.00% | 1.75% |
| Multi-Grip Bar | 33.79% | 39.91% | 25.53% | 0.77% |
| Hex/Trap Bar | 33.88% | 36.61% | 29.17% | 0.33% |
| Curl Bar | 31.45% | 36.26% | 31.61% | 0.68% |
| Deadlift Bar | 28.37% | 26.59% | 44.37% | 0.68% |
| Squat Bar | 19.10% | 28.56% | 51.66% | 0.68% |
| Camber Bar | 17.72% | 25.74% | 50.72% | 5.82% |
| Buffalo/Duffalo Bar | 16.69% | 24.87% | 51.85% | 6.58% |
| Bamboo/Tsunami Bars | 13.42% | 21.96% | 55.67% | 8.95% |
| Axle Bar | 11.68% | 21.43% | 61.63% | 5.25% |
| Log Bar | 8.76% | 12.59% | 73.14% | 5.50% |
The Multi-Grip Bar Jumped from the 4th most interesting specialty bar to #2.
| Specialty Bar | February Rank | September Rank | Change |
| Safety Squat Bar | 1 | 1 | 0 |
| Multi-Grip Bar | 4 | 2 | 2 |
| Hex/Trap Bar | 2 | 3 | -1 |
| Curl Bar | 3 | 4 | -1 |
| Deadlift Bar | 5 | 5 | 0 |
| Squat Bar | 6 | 6 | 0 |
| Camber Bar | 8 | 7 | 1 |
| Buffalo/Duffalo Bar | 7 | 8 | -1 |
| Bamboo/Tsunami Bars | 0 | ||
| Axle Bar | 9 | 9 | 0 |
| Log Bar | 10 | 10 | 0 |
38% believe the Camber is worth additional $$ for Multi-Grip Bars, but a good amount simply does not know.

SSB Beats Out Transformer, Marrs, Belt Squat as First Lower Body Tool
- The most economical option (traditional SSB) received about half of the votes when asking which one you’d likely add first to home gym.
- Only 22% said that they would not be interested in any of them, which is pretty low and helps show the evolution of specialty bars over the past few years.
- The standalone belt squat narrowly beat out the “Marrs or Transformer Bar” option.

With about 3.5x more votes than traditional hex, the more modern Open Trap Bar is easily the more popular option when it comes to a better trap bar option for most.

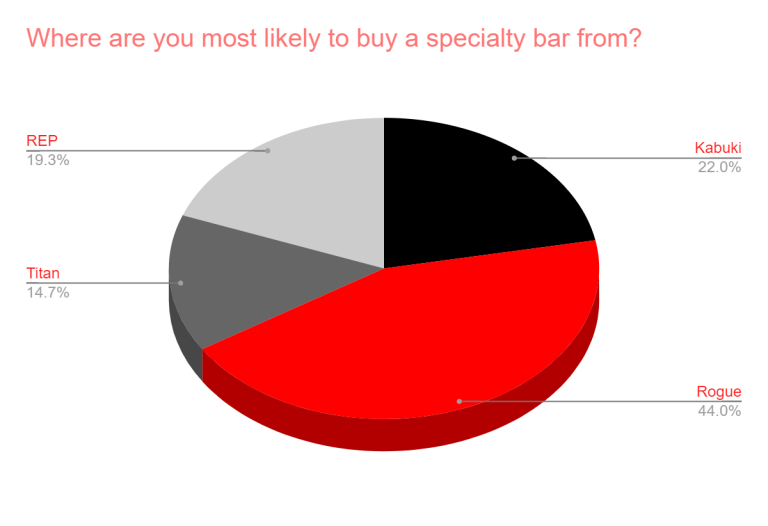
Where are you buying a specialty bar from? Rogue wins against several other popular options, even though they aren’t especially known for the specialty bar options. The Rogue brand most likely played a heavy contributor.
Rack Data
32% own Racks with 1 Inch Holes
The “Monster” line/PR-5000 type racks were the most popular, with about 32% of the votes, but it was close. Monster Lite/PR-4000 type racks were just a few % points behind them. These two options combined for over 61% of the total, with “none/other/IDK” and “2×2 or similar” combining for the rest.

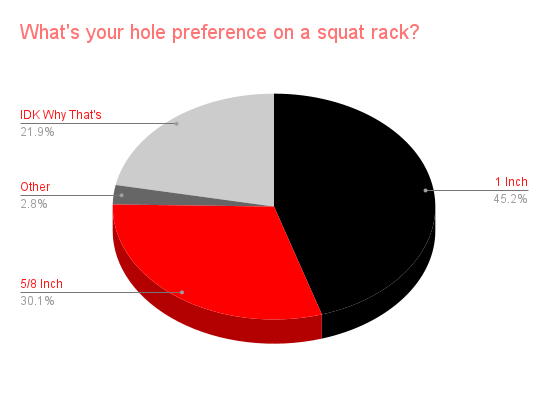
1 Inch is the easy winner with 45% of the votes and had about a third more votes than the runner-up, 5/8 inch, when asked about hole preference on a squat rack.
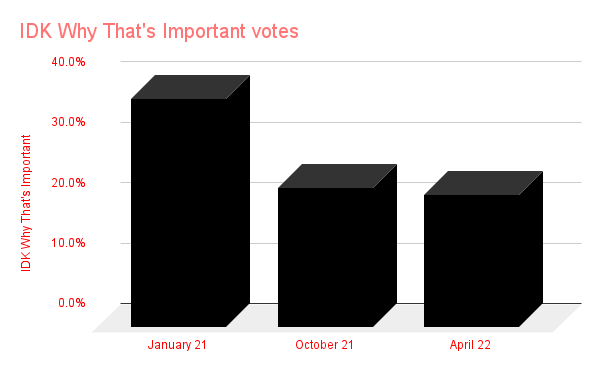
“I Don’t Know Why That’s Important” votes were 38% in January 2021 but just 22% a little over a year later when asked about hole size preference on squat rack.
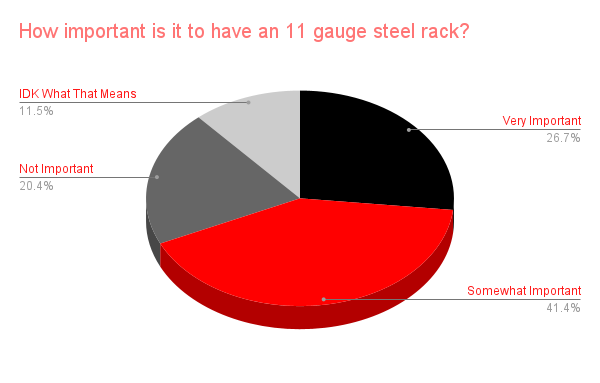
About 2 in 3 say that it is at least somewhat important to have an 11 gauge rack, but only 27% say “Very Important.”
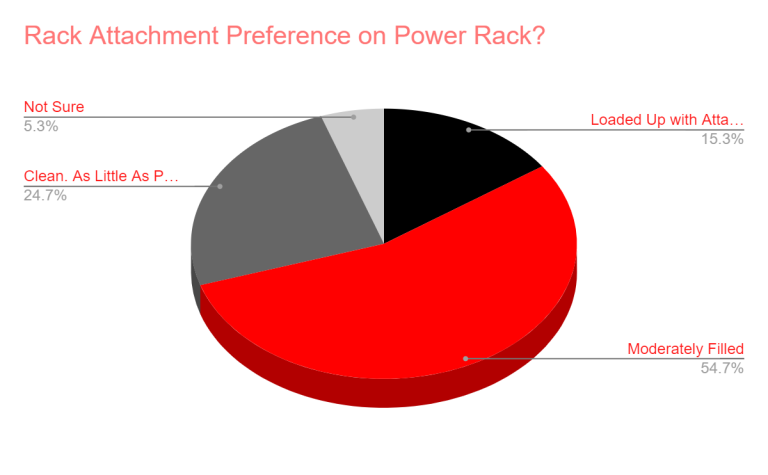
Most like their Power Rack Moderately Filled with Power Racks
Those power racks you see on the internet that are absolutely loaded up with attachments are only ideal for about 15%. 55% would like it moderately filled, and another 25% want them to be as clean as possible.-
Attachment Data
The Full List
This looks at ALL results between high, medium, low, and neutral votes.
The most basic ones were voted as the ones with the highest interest and the more advanced/complicated lowest.
| Attachment | % High | % Medium | % Low | % Neutral |
| Spotter Arms | 60.06% | 23.49% | 15.35% | 1.10% |
| Plate Storage | 53.49% | 26.83% | 18.13% | 1.56% |
| Landmine | 50.00% | 31.68% | 16.92% | 1.40% |
| Multi-Grip Pull Up Bar | 46.81% | 31.77% | 19.92% | 1.51% |
| Straight Pull Up Bar | 43.58% | 27.43% | 27.08% | 1.92% |
| Barbell Storage | 40.79% | 27.66% | 30.25% | 1.30% |
| Dip Attachment | 40.12% | 33.48% | 24.41% | 2.00% |
| Leg Curl/Leg Extension | 37.65% | 31.07% | 30.12% | 1.17% |
| Selectorized Lat Tower | 36.89% | 31.36% | 27.82% | 3.93% |
| Band Pegs | 35.09% | 32.60% | 30.44% | 1.87% |
| Functional Trainer Like Attachment (Selectorized) | 34.24% | 27.08% | 35.45% | 3.23% |
| Roller J Cups | 33.15% | 33.04% | 31.14% | 2.66% |
| Plate Loaded Lat Tower | 29.41% | 32.44% | 35.29% | 2.86% |
| Functional Trainer Like Attachment (Plate Loaded) | 26.83% | 30.66% | 39.42% | 3.09% |
| Sandwich J Cups | 23.95% | 31.99% | 38.66% | 5.40% |
| Drink Spotter | 17.62% | 10.71% | 66.55% | 5.12% |
| Jammer Arms | 17.45% | 31.87% | 46.50% | 4.17% |
| Monolift Attachment | 17.42% | 28.43% | 50.19% | 3.96% |
| Globe Grip Pull Up Bar | 16.19% | 24.59% | 56.09% | 3.13% |
| Smith Machine | 7.98% | 10.37% | 74.14% | 7.50% |
Pulley Systems are likely the most popular attachment you can add to your rack right now.
This battle was between the most popular (larger) ones today – pulley systems, belt squats, landmines, and jammer arms. It wasn’t even close. With 54% of the votes, pulley systems were the easy #1 choice. The other votes were relatively spread out between the other three.

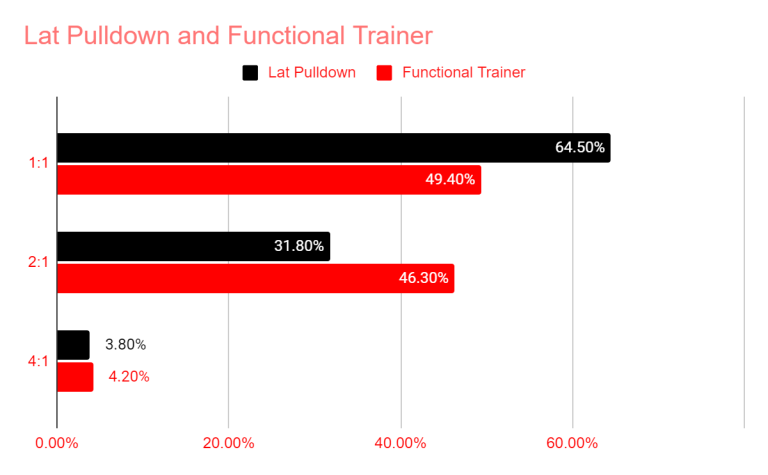
Pulley ratio preference varies for lat pulldown vs. functional trainer
To start, you’ll see that basically nobody wants a 4:1 ratio. Then with the lat pulldown about 65% want a 1:1 ratio vs. 32% wanting a 2:1. It’s a bit closer for functional trainer with 49% voting 1:1 and 46% 2:1.
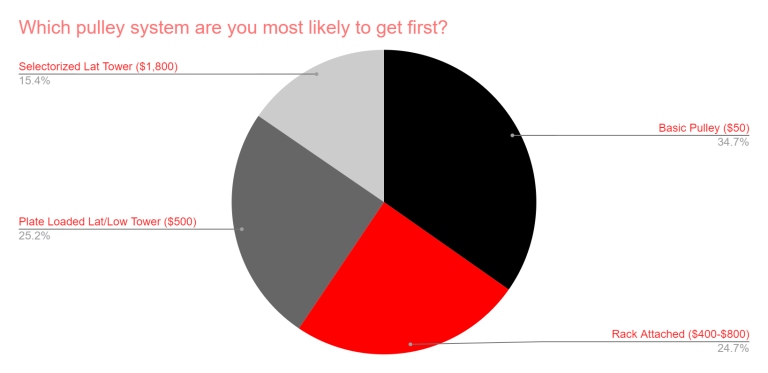
Most are likely to simply get a basic pulley system.
Bench Data
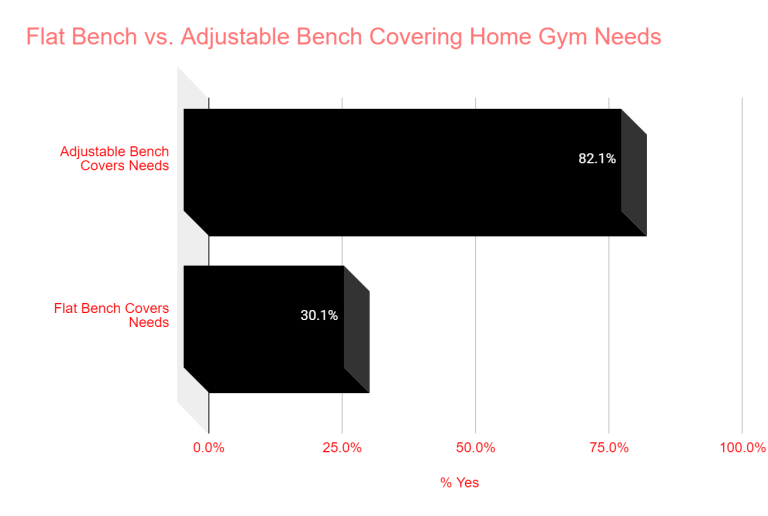
Just 30% believe that an adjustable bench covers their home gym needs, while 82% think an adjustable bench does.
We’ve done this survey before, and the results didn’t change too much. It’s ultimately why we typically recommend someone save up for an adjustable bench rather than just settling for a flat bench.
A real-life example: Adjustable vs. Flat to start a home gym
In a head-to-head matchup between a couple of reasonable home gym bench options, about 4.2x more voted for the AB-3100 over the FB-5000 when asked what’s a better bench to start a home gym with.

Adjustable Bench Ownership Going Up
About 13% more own adjustable benches compared to last year, while flat bench ownership is down slightly.

REP benches more popular than Rogue benches
Last year REP received 52% of the votes, so their lead grew. They continue to have the reputation of having the best value home gym benches.

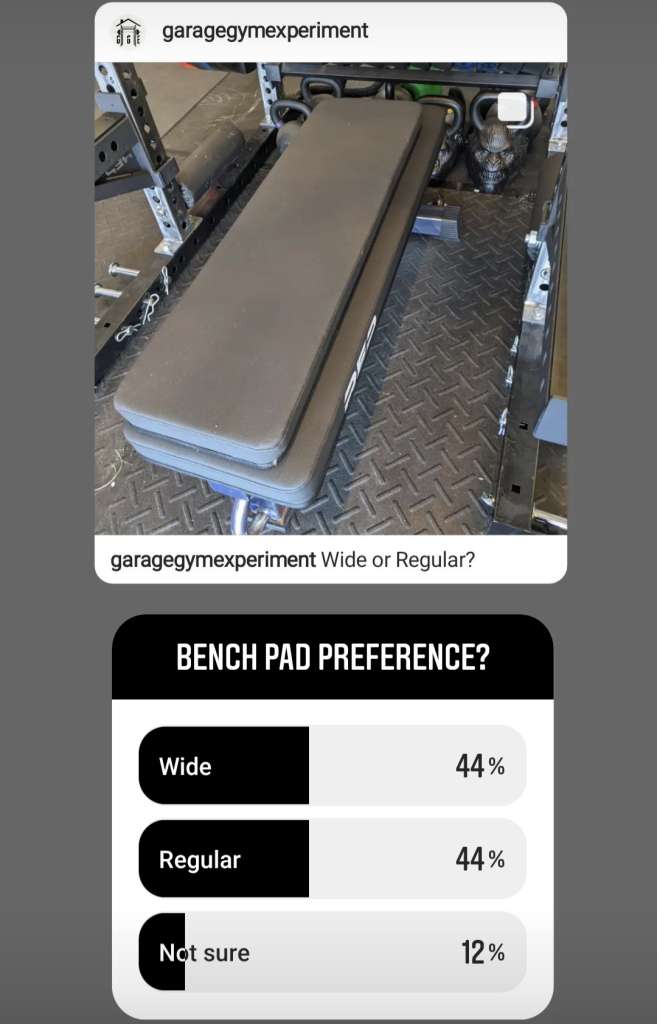
When asked about bench width preference, it was a tie between wide and regular.
Only 12% were unsure so most know what they want.
Equipment Preferences
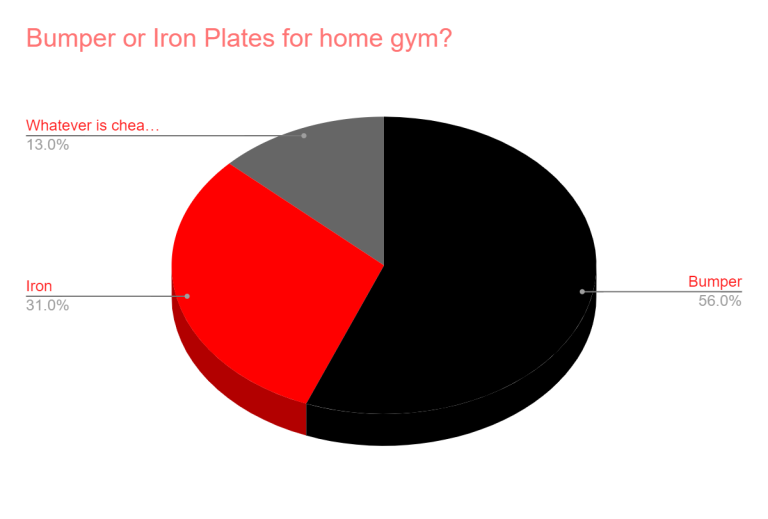
Bumper plates for most over iron.
Consistent with most polls done in the past, bumper plates are the easy winner with 56% of the total votes. Iron made up a little less than one-third of voting and “whatever is cheapest,” 13%.
Top strength machines for home gym are the functional trainer and lat pulldown.
The functional trainer was the top Selectorized choice, but last for plate loaded.
The Lat pulldown was the top plate loaded choice.

The choice of dumbbells for the home gym are traditional hex dumbbells, according to most.
Traditional hex dumbbells are the choice for most, with about 46% of the votes. Adjustable Dumbbells were an easy second and received nearly 4x more votes than loadable.
The results did not change much at all from 2021

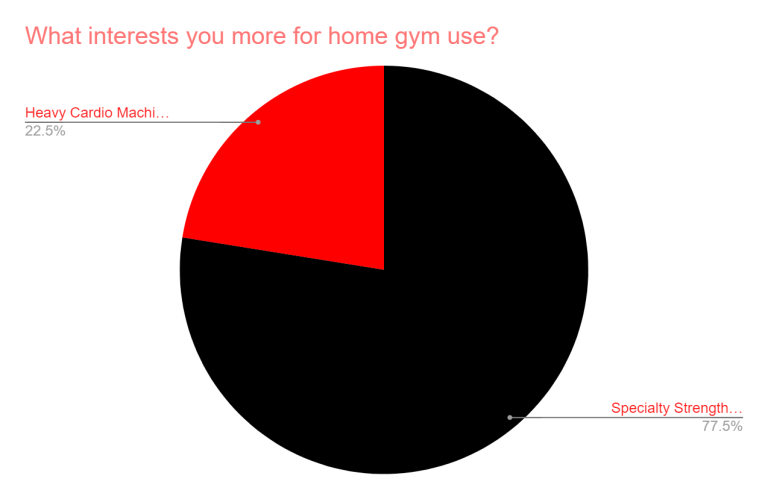
78% said they had more interest in “Specialty Strength Machines” vs. “Heavy Cardio for their home gym use.
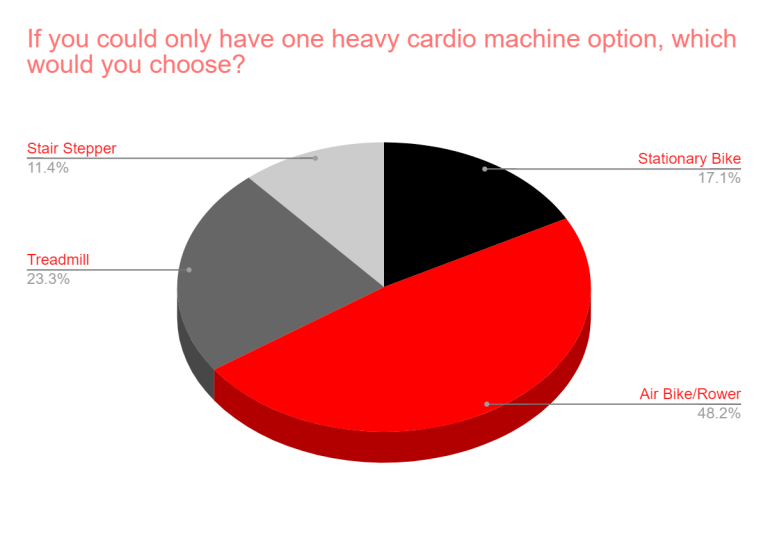
Cardio Equipment
The top cardio choice (but barely) is the rower.
The rower eeks out a victory over the air bike with the treadmill and stationary bike a bit behind.

Towards the end of the year we combined air bike/rower and added a Stair Stepper, which received about 11% of the votes.
Have You Heard of These Companies? & Do You Own Anything From These Companies?
This was the 9th time we’ve done this survey, asking whether you’ve heard of 30 different companies. The list varies each time slightly. Some companies have been on this list all nine times, while others may be there first (view additional analysis).
| Company | % Yes | Change from March | Change from June 2019 |
| Rogue Fitness | 99% | 0% | 1% |
| Titan Fitness | 98% | 0% | 6% |
| Peloton | 97% | ||
| Rep Fitness | 96% | 0% | 30% |
| Eleiko | 94% | ||
| AbMat | 92% | 2% | |
| Sorinex | 91% | 6% | 34% |
| Kabuki Strength | 91% | 8% | 47% |
| Fray Fitness | 91% | 7% | 185% |
| Bells of Steel | 88% | 7% | 96% |
| American Barbell | 88% | 4% | 16% |
| PRX Performance | 88% | 10% | 29% |
| Fringe Sport | 87% | 6% | 34% |
| Get RXd | 81% | 8% | 35% |
| Force USA | 76% | 15% | 377% |
| Elite FTS | 76% | 6% | |
| The Strength Co | 68% | 30% | |
| Body-Solid | 64% | 20% | 18% |
| Powertec | 50% | 15% | |
| Bridge Built | 48% | 12% | |
| Synergee Fitness | 46% | 82% | |
| Kleva Built | 44% | ||
| Surplus Strength | 43% | ||
| Gorila Fitness | 41% | ||
| Crandall Fitness | 40% | 24% | |
| Straydog Strength | 36% | ||
| I Sell Fitness | 35% | 172% | |
| Gymway USA | 34% | 35% | |
| Bolt Fitness | 25% | ||
| Freedom Fitness Equipment | 22% | 174% |
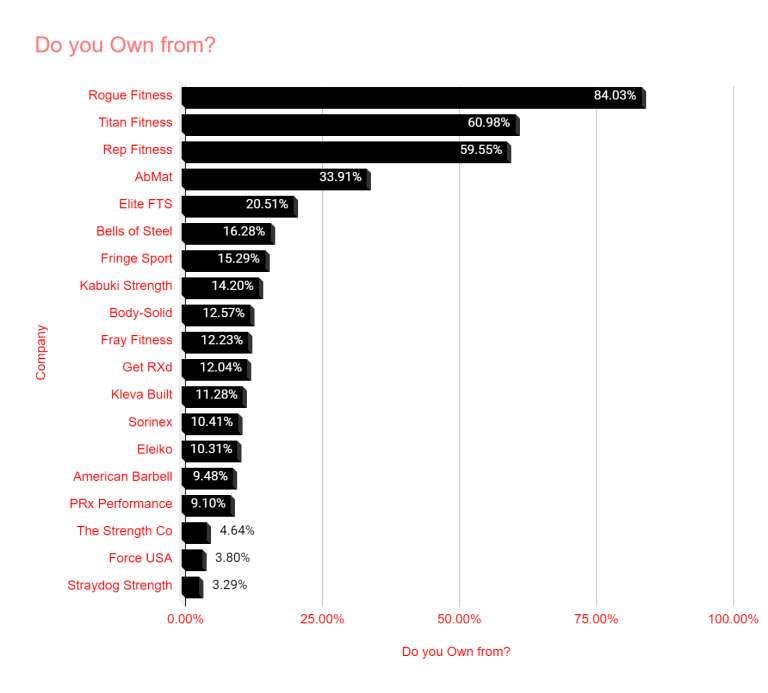
Do you own anything from these companies?
- Over 84% own something from Rogue, which is insane and helps show how dominant they are.
- Titan and REP are easily in 2nd & 3rd place with around 3 out of 5 voting yes.
- About a third likely have an AbMat.
- Then, everyone else is around 20% or below.
- The largest risers include Bells of Steel is up 71% (9.54% to 16.28%), REP is up 55% (38.31% to 59.55%), and Titan is up 40% (43.71% to 60.98%)
Other Interesting Survey Results
41% are filling their gym up with REP (with cost in mind), beating out Rogue.
This was a battle between Rogue, REP, Titan, and Bells of Steel. They seem to be the four largest brands right now with offerings to the home gym scene. “Amazon Brands” are omitted here.

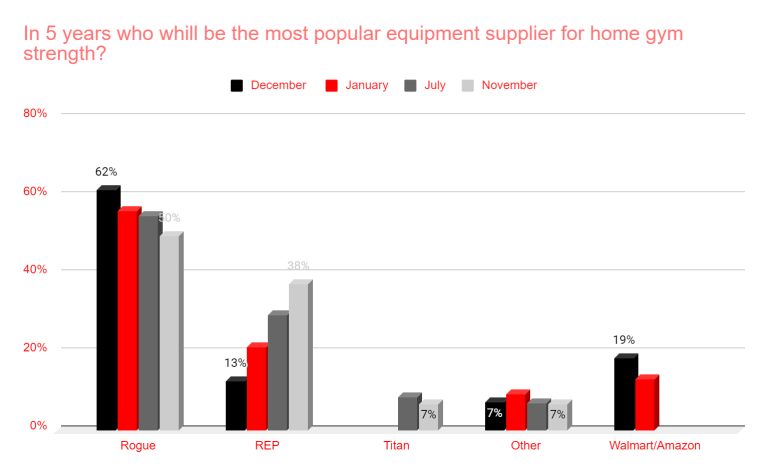
About half believe Rogue will be the most popular equipment supplier for home gym strength in 5 years.
Nevertheless, REP has made up quite a bit of ground in about a year with this question. In December 2021, they received about 13% of the votes, but this time around it was 38%.
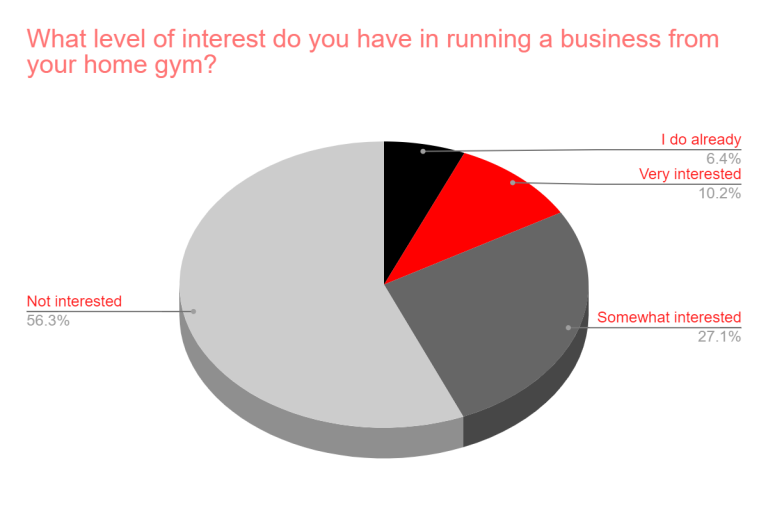
56% are not interested in running a business out of their home gym, but 37% are at least “somewhat interested.”
There is no doubt that this topic continues to gain more traction. It will be interesting to see what this data looks like in 2022 (view additional Home Gym Business figures).
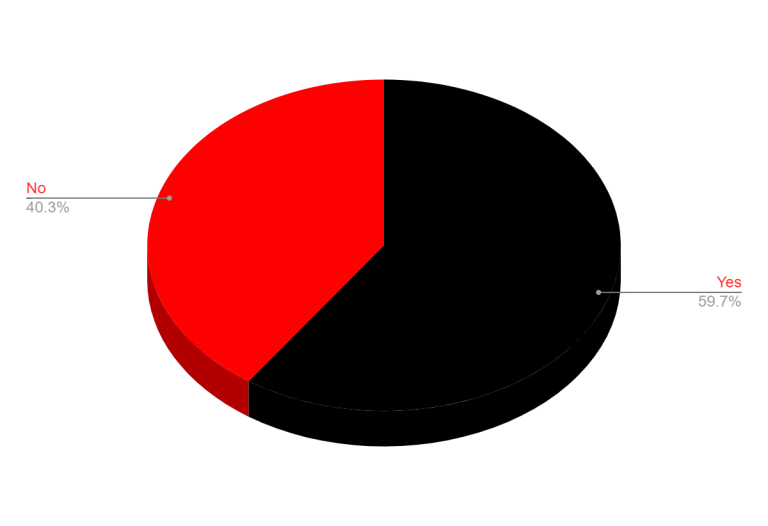
About 3 out of 5 say yes; they are more likely to buy something from gym equipment companies that actively participate in the community! Many appreciate the community activism performed by many companies.
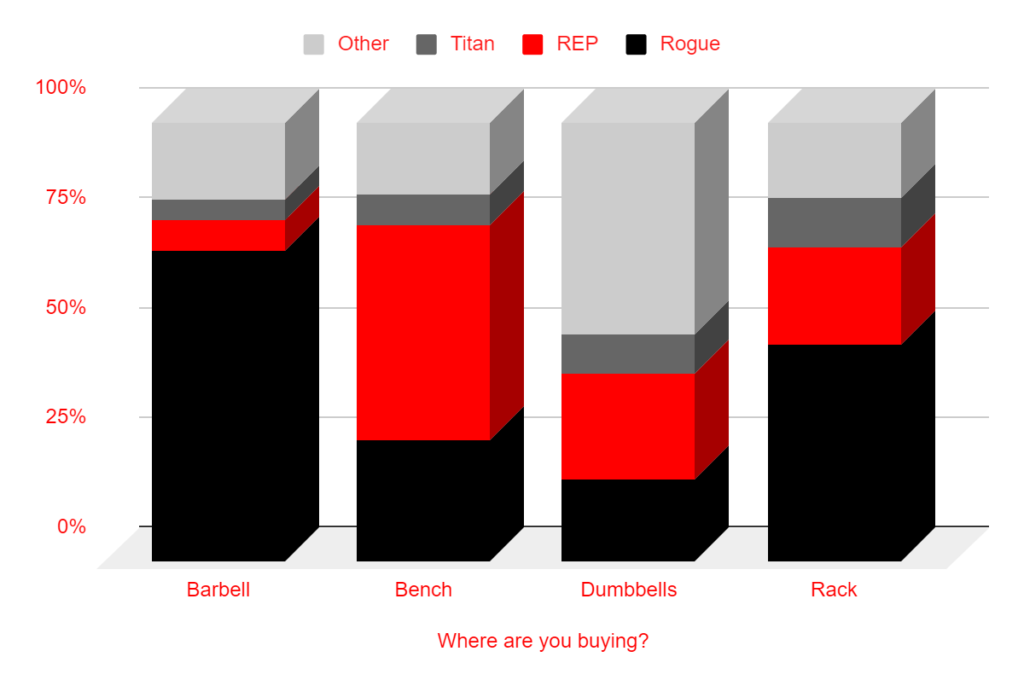
Where are you buying a barbell, bench, dumbbells, and a rack?
Rogue dominates barbells and racks with over 70% of barbell votes and almost half of the rack votes.
Nearly half said they would likely purchase dumbbells with another company. This isn’t a surprise since most dumbbells are the same.
REP wins the bench battle with nearly half of the votes.
Titan did come in last for all.
| Where are you buying? | Barbell | Bench | Dumbbells | Rack |
| Rogue | 71% | 28% | 19% | 49% |
| REP | 7% | 49% | 24% | 22% |
| Titan | 5% | 7% | 9% | 11% |
| Other | 18% | 17% | 48% | 17% |
Tech entering the home gym space. Many aren’t too excited.
As more and more technology is emerging, the interest in those answering these survey questions is decreasing.
For example, in January, about 14% expressed being “big fans” of tech entering the home gym space, while it was below 10% this time.
While the overall interest is only slightly down, it’s notable that it is not going up as one might have predicted a year ago.
| How do you feel about tech entering the home gym space? | January 2022 | August 2022 | % Change |
| Big fan | 14.10% | 9.70% | -31% |
| Fan | 23.10% | 25.60% | 11% |
| Neutral | 48.70% | 51.60% | 6% |
| Keep me away | 14.10% | 13.10% | -7% |
# of fitness apps are not too much higher than amount used in 2019
This was a repeat question from 2019, and the numbers didn’t change as much as you might expect. 35% use 0 fitness apps, only down from 39% in 2019.
We saw a slight bump in those that use 1, 2, or more, but it was not a drastic change.
| How many fitness apps do you use? | 2019 | 2022 | Change |
| 0 | 39.10% | 34.69% | -11% |
| 1 | 31.70% | 33.32% | 5% |
| 2 | 21.50% | 23.48% | 9% |
| Three or more | 7.70% | 8.51% | 11% |
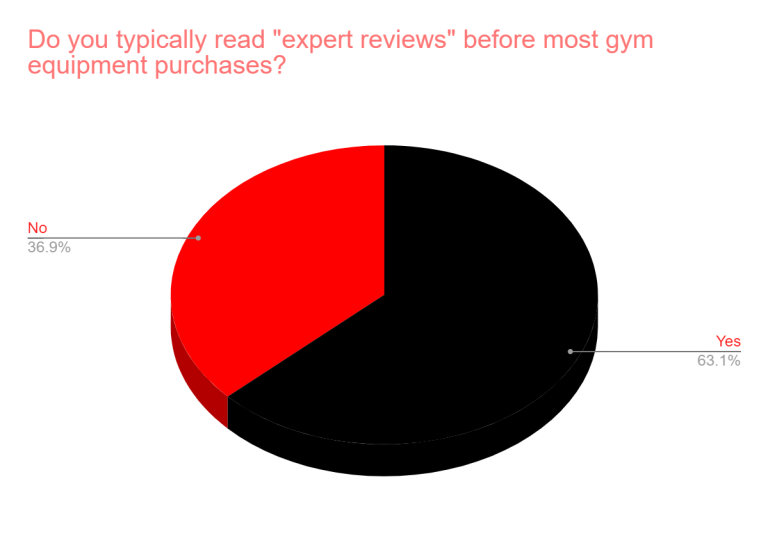
63% typically read “expert reviews” before most gym equipment purchases?
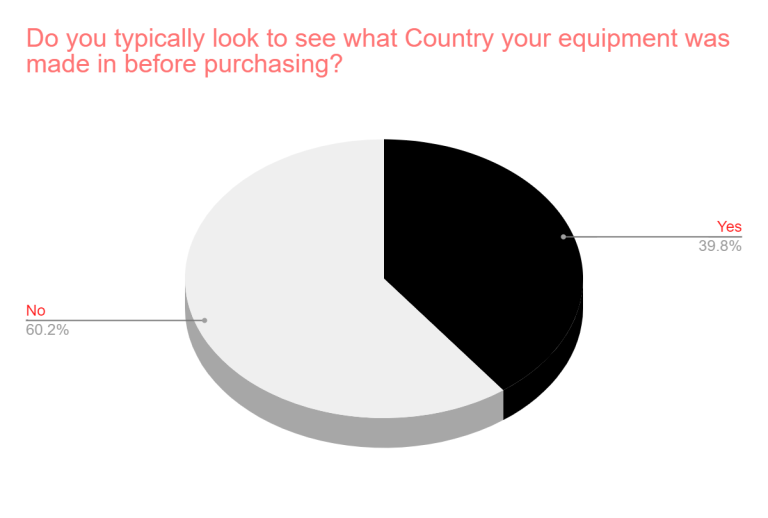
Only about 40% say they typically look to see what country gym equipment was made before purchasing.
Only 5% say it’s “Almost Essential” and 45% “Not Important” when buying gym, identifying the importance of equipment made in your country.

Compared to 2021, “Not Important is up 22% since April of 2021, while “Almost Essential” is down -18%. The overall amount of “Neutral” voters is down as well.
| April 2021 | November 2021 | June 2022 | April 2021 to June Change | |
| Almost Essential | 6% | 7% | 5% | -18% |
| Important | 28% | 36% | 30% | 9% |
| Not Important | 37% | 38% | 45% | 22% |
| Neutral | 29% | 20% | 19% | -33% |

How much of your gym was made in your country? The responses were relatively spread out, with the most popular answer being 25-50%. The least popular answer was 75-100%

Compared to November 2021, less have a higher proportion of made-in-their-country gyms.
| What proportion of your gym was made in your Country? | November 2021 | June 2022 | % Change |
| 0-25% | 22% | 28% | 24% |
| 25-50% | 29% | 32% | 9% |
| 50-75% | 29% | 26% | -9% |
| 75-100% | 19% | 14% | -29% |

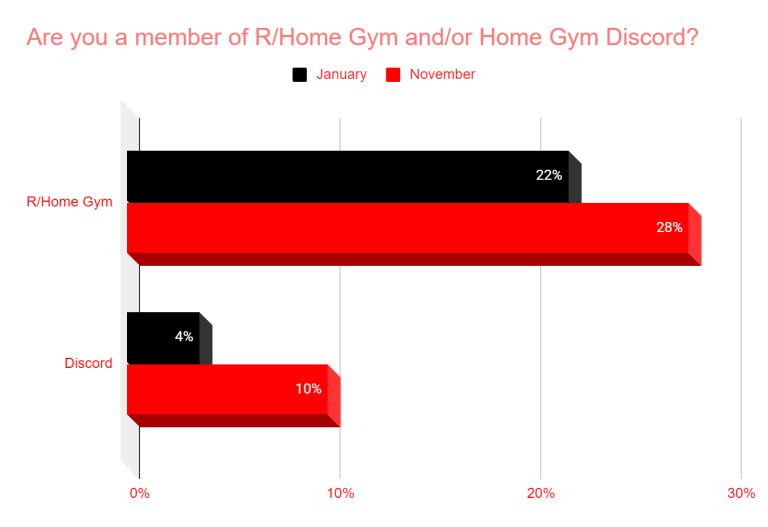
28% are a member of r/home gym (22% in January), while 10% are on Home Gym Discord 3.6% in January).

The Home Gym Decor List
Four options were ahead of all others, with at least 35% voting “need to have.” Those were upgraded lighting, mirrors, whiteboard, and flags/banners.
Outside of the top four, only two had over 20% voting “need to have.” Those were TVs and painted walls. All other options had around 11% or lower “need to have” votes.
Need to Have | Maybe | No Interest | Neutral | |
| Upgraded Lighting | 43% | 36% | 14% | 8% |
| Mirrors | 38% | 25% | 28% | 8% |
| Whiteboard | 35% | 31% | 24% | 9% |
| Flags/Banners | 35% | 32% | 19% | 14% |
| TV | 26% | 33% | 36% | 5% |
| Painted Walls | 25% | 31% | 27% | 17% |
| Posters | 11% | 35% | 44% | 11% |
| Wall Art | 9% | 32% | 50% | 9% |
| Medals | 7% | 18% | 69% | 7% |
| Chalk Board | 5% | 20% | 64% | 11% |
| Plate Snacks | 5% | 13% | 70% | 12% |
| Plants | 4% | 13% | 76% | 7% |
That’s going to do it!
Blog posts with survey results are sent out weekly. Subscribe to the blog below to stay in the loop.
Comments